Figure 3.
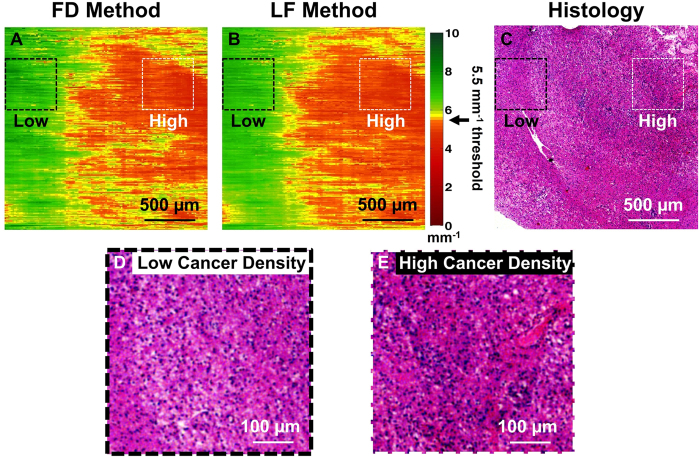
En face OCT attenuation colormaps of an ex vivo, freshly resected human brain cancer tissue computed using (A) the FD method and (B) the LF method. The color-coded attenuation map represents areas of low cancer density (indicated by green color, corresponding to high attenuation) and high cancer density (indicated by red color, corresponding to low attenuation). (C) Corresponding histology image (H&E stained) of the scanned tissue area for validation. Zoomed-in regions were provided in (D) and (E) to demonstrate the histology found in areas with low cancer density (black dotted box) and high cancer density (white dotted box), respectively.

