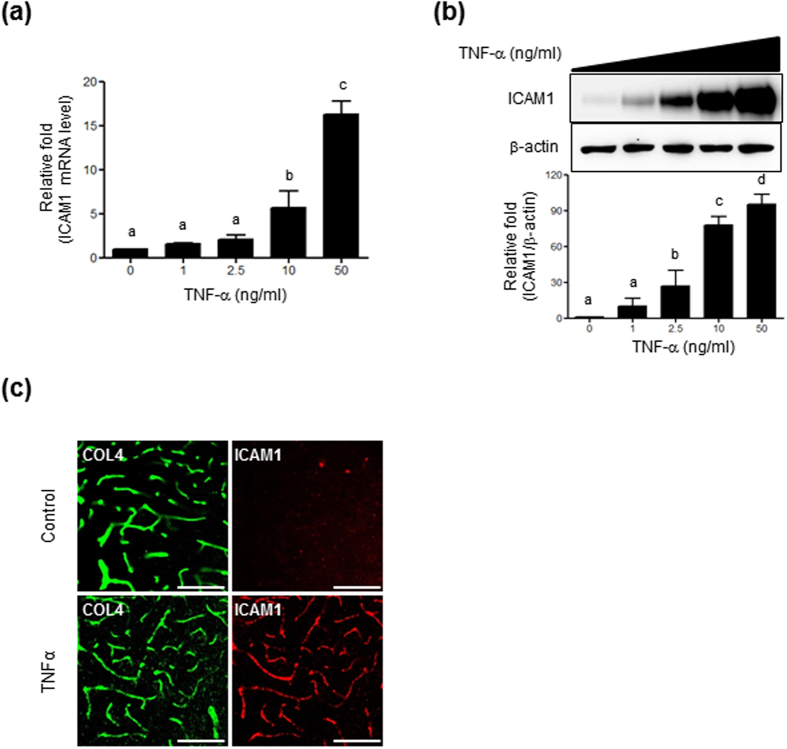
Figure 1. Effect of TNF-α on ICAM1 expression.
HBMVECs were seeded in a 6-well plate and treated with various doses of TNF-α for 24 h. (a) ICAM1 mRNA levels. Levels were normalized to GAPDH and expressed relative to ICAM1 from non-treated controls (n = 3). (b) ICAM1 protein levels determined by western blot analysis using 20 μg of cell lysates. Quantification was performed using densitometry (Image J software). Results were normalized to β-actin. Uncropped blots are found in Supplementary Fig. S5. (c) Sections from saline or TNF-α -injected mouse brains immunostained with vessel markers; anti-collagen type IV (COL4; green) and anti-ICAM1 (red) antibodies. Scale bars, 100 μm. Bars represent mean ± SEM (n = 3). Data were analyzed by a one-way ANOVA followed by a post hoc Student-Newman-Keuls test. The different characters denote significant differences (p < 0.05) among the groups.

