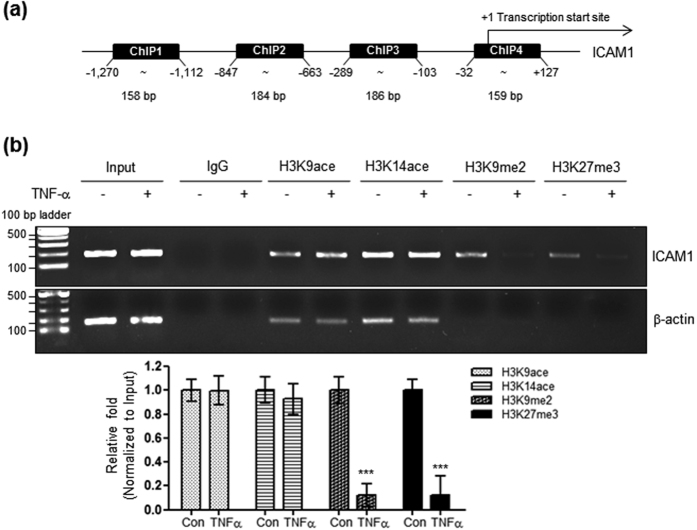
Figure 2. Effect of TNF-α on histone H3 lysine acetylation or methylation within the Icam1 promoter in HBMVECs.
(a) Primer sites (−1,270 to −1,112, 158 bp; −847 to −663, 184 bp; −289 to −103, 186 bp; −32 to +127, 159 bp) for ChIP are numbered relative to the main transcription start site (+1). (b) Genomic DNA was isolated from HBMVECs treated with 10 ng/mL of TNF-α for 24 h. A ChIP assay was performed with antibodies specific for H3K9ace, H3K14ace, H3K9me2, or H3K27me3 (listed in Table 3). The DNA isolated after ChIP was used for a semi-quantitative PCR with ChIP 2 primers (listed in Table 2). Input represents amplification of the total input DNA from whole cell lysates. The amount of DNA after ChIP was normalized to the input DNA level. Quantification was performed using densitometry (Image J software). Results were normalized to β-actin. Bars represent mean ± SEM (n = 3). ***Denotes statistically significant difference at p < 0.001. Uncropped blots are found in Supplementary Fig. S6.

