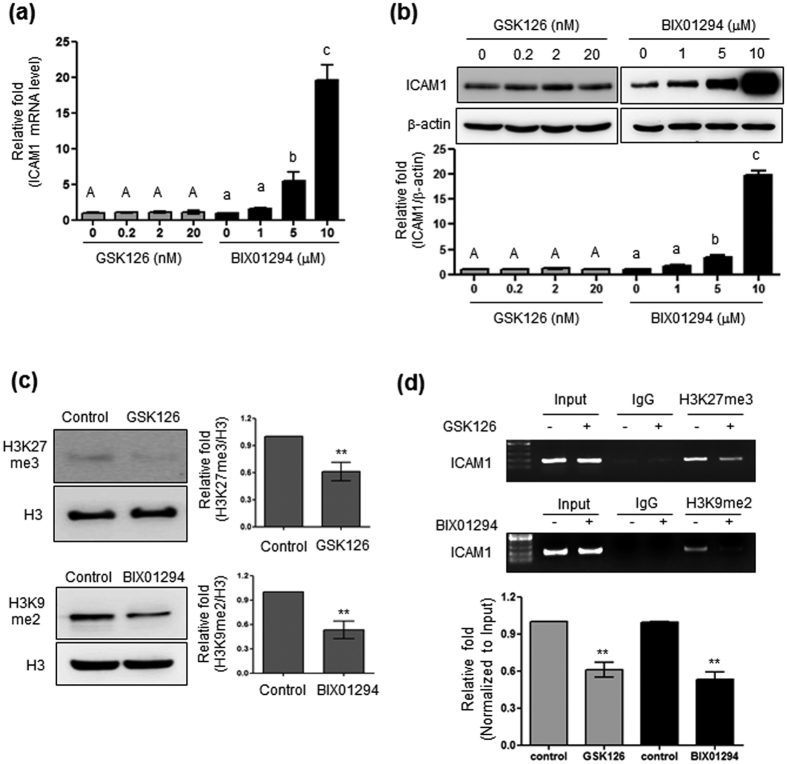
Figure 3. Effect of EZH2 or G9a specific inhibitors on ICAM1 gene expression.
(a) ICAM1 mRNA levels in HBMVECs treated with GSK (0, 0.2, 2, and 20 nM) or BIX01294 (0, 1, 5, and 10 μM). Results were normalized to GAPDH and expressed relative to ICAM1 from non-treated controls. (b) ICAM1 protein from total cell lysates of HBMVECs treated as above. Quantification was performed using densitometry (Image J software). Results were normalized to β-actin. (c) H3K27me3 and H3K9me2 levels determined from 30 μg of the cell lysates (described as above) and separated by 15% SDS-PAGE. Results were normalized to histone H3. Uncropped blots are found in Supplementary Fig. S7. (d) Binding of H3K27me3 or H3K9me2 to the Icam1 promoter site quantified by ChIP with anti-H3K27me3 or anti-H3K9me2 specific antibodies. Input represents the total input DNA from whole cell lysates. Bars represent mean ± SEM (n = 3). The different characters denote significant differences (p < 0.05) between the groups. **Denotes statistically significant difference at p < 0.01. Uncropped blots are found in Supplementary Fig. S7.

