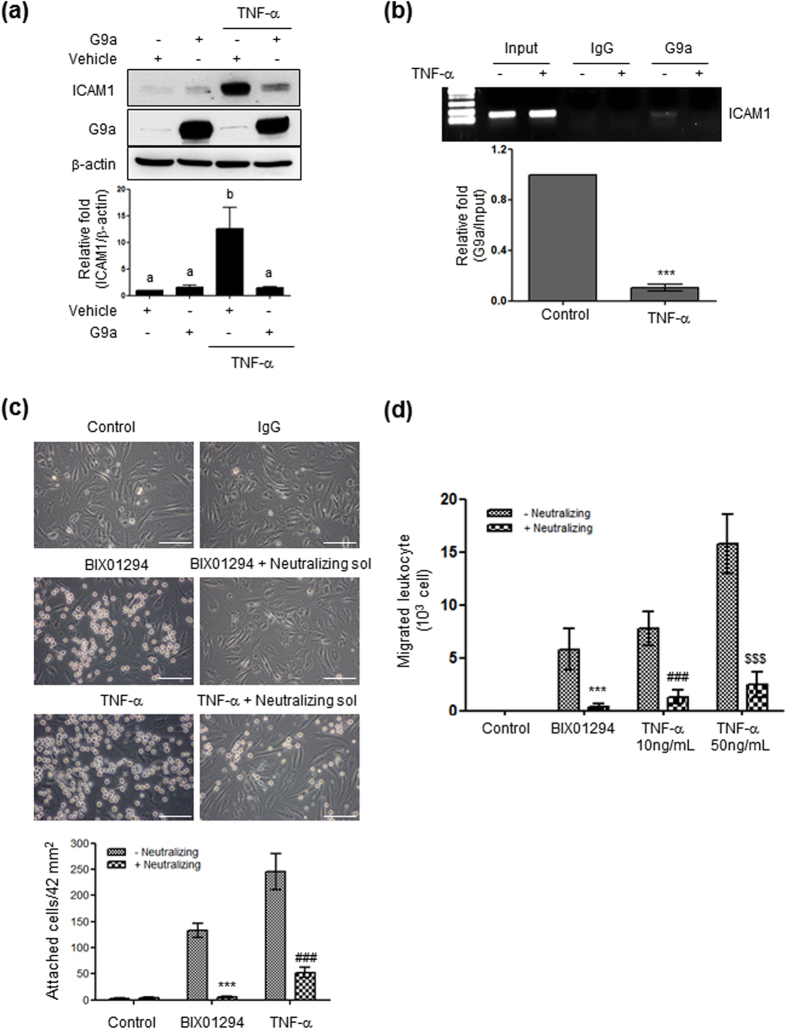
Figure 4. The role of G9a in the expression of ICAM1 and leukocyte adhesion.
(a) ICAM1 protein levels in G9a-overexpressing cells treated with TNF-α for 24 h. Uncropped blots are found in Supplementary Fig. S8. (b) A ChIP assay performed with a G9a-specific antibody. (c,d) Photographs showing HL-60 cell adhesion and migration. HBMVECs seeded in a 12-well plate were incubated with 10 μM BIX01294 or 10 ng/mL TNF-α for 24 h, and treated with 2 μg of rabbit IgG or neutralizing solution (anti-ICAM1 rabbit polyclonal and anti-VCAM1 rabbit monoclonal) for 0.5 h before the addition of 105 HL-60 cells. Uncropped blots are found in Supplementary Fig. S8. (c). Attached HL-60 cells were observed and counted under an inverted microscope with 400× magnification (mean ± SEM; n = 5). Scale bars, 50 μm. Values are considered significant at ***p < 0.001 vs BIX01294; ###p < 0.001 vs 10 ng/mL TNF-α. (d) Quantitation of HL-60 cell transmigration assay. The bar graph indicates the number of migrating HL-60 cells (mean ± SEM; n = 3–4). Values are considered significant at ***p < 0.001 vs BIX01294; ###p < 0.001 vs 10 ng/mL TNF-α; $$$p < 0.001 vs 50 ng/mL TNF-α.

