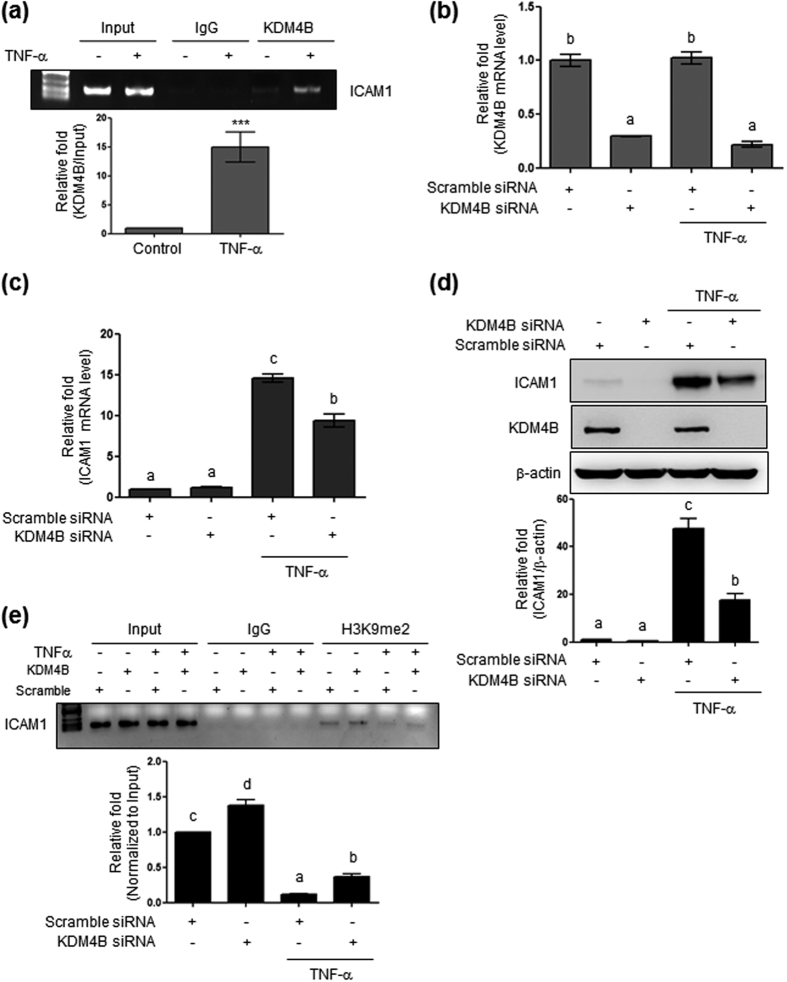
Figure 5. Effect of KDM4B knockdown on ICAM1 expression.
(a) Isolation of Genomic DNA from HBMVECs transfected with 100 nM scrambled or 100 nM KDM4B siRNA followed by TNF-α treatment (10 ng/mL, 24 h). ***Denotes statistically significant difference at p < 0.001. (b) Confirmation of transfection efficiency through reduced KDM4B mRNA levels. (c) ICAM1 mRNA expression in cells transfected with scrambled or KDM4B siRNA followed by TNF-α treatment. (d) ICAM1 protein levels determined by western blotting using 15 μg of cell lysate and 8% SDS-PAGE. (e) H3K9me2 binding to the Icam1 promoter region determined by ChIP. Results show the mean ± SEM (n = 3–4). The different characters denote significant differences (p < 0.05) among the groups. Uncropped blots are found in Supplementary Fig. S9.

