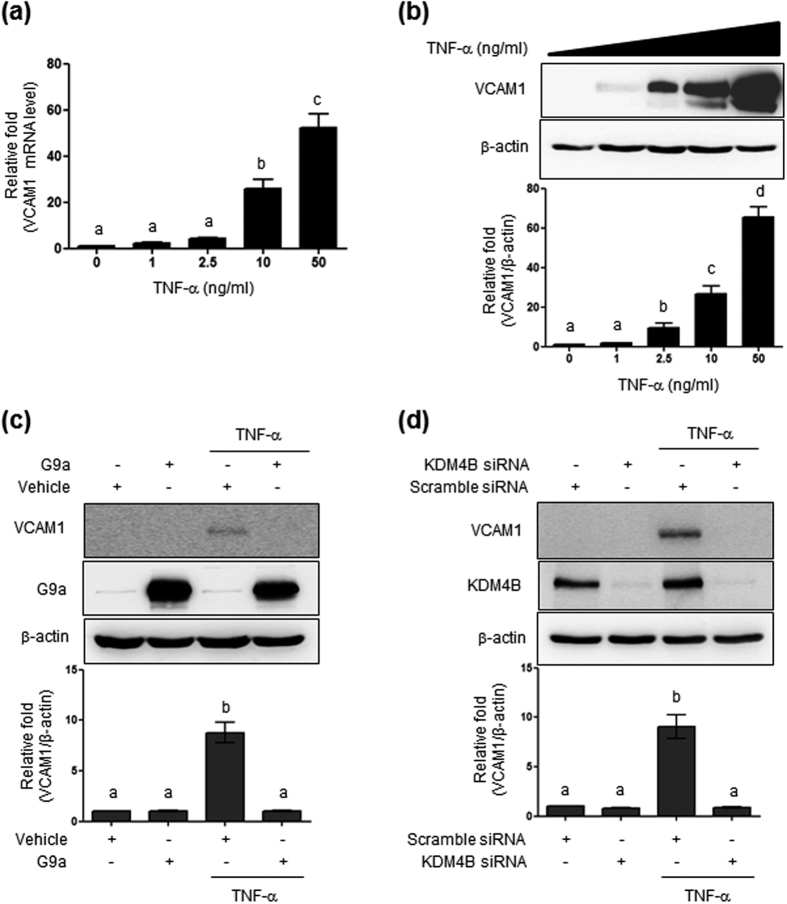
Figure 6. Effect of G9a overexpression and KDM4B knockdown on TNF-α-induced VCAM1 expression.
(a) VCAM1 mRNA levels in cells exposed to diverse doses of TNF-α for 24 h. (b) VCAM1 protein levels determined by western blotting using 30 μg of cell lysates. (c) Blocking of TNF-α-induced VCAM1 expression by G9a. Efficiency of MSCV-hydro-G9a transfection was confirmed by western blotting using 20 μg of cell lysate and 8% SDS-PAGE. (d) VCAM1 quantification was performed through densitometry (Image J software). Results were normalized to β-actin. Bars represent mean ± SEM (n = 3). The different characters denote significant differences (p < 0.05) among the groups. Uncropped blots are found in Supplementary Fig. S10.

