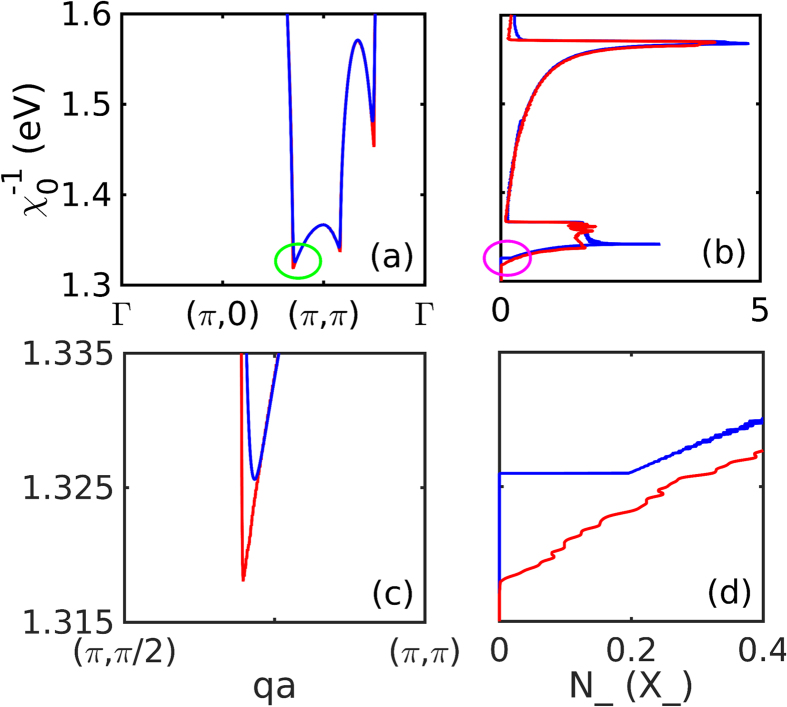
Figure 12. Origin of SDOS features.
(a) Inverse susceptibility  for Bi2201 at doping x = 0. Note that
  (circled region). Curves are at T = 10 (red) and 100 K (blue). (b) Corresponding susceptibility density of states (SDOS) N−(X−), plotted horizontally, corresponding to the susceptibility of (a). (c,d) Blowups of circled regions in (a,b).

