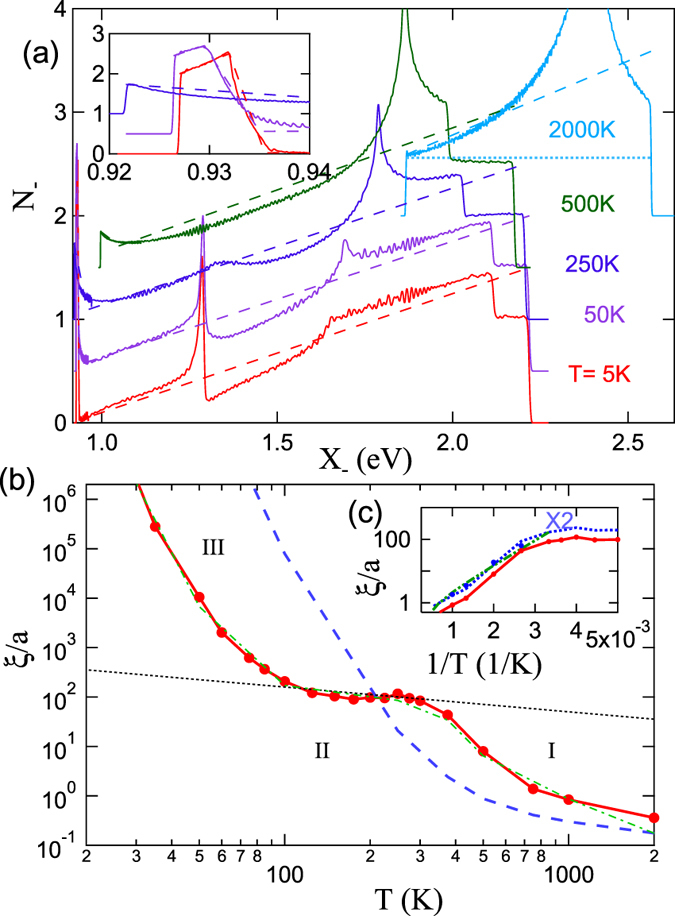
Figure 13. Structures in LSCO correlation length.

(a) SDOS for undoped LSCO at several temperatures; light-blue dotted line gives OZ form of SDOS. (b) Corresponding temperature dependence of correlation length ξth. For x = 0, the red solid line with filled dots is ξth calculated from the solid lines in (a), while the thin green dot-dashed line is based on the dashed lines in (a), showing that ξth is relatively insensitive to the structures away from threshold. In contrast, the blue dashed line is based on the shape of the SDOS at T = 2000 K, but shifted and renormalized to match the SDOS at lower T, illustrating sensitivity to the leading edge structure. The black dotted line illustrates the scaling ξth ∝ T−1/2. (c) Calculated ξth replotted for x = 0 (red solid line with filled circles) compared with ξ1/2 (blue filled circles) and with experiment (green dot-dot-dashed line)58; the blue dotted line is twice ξth.
