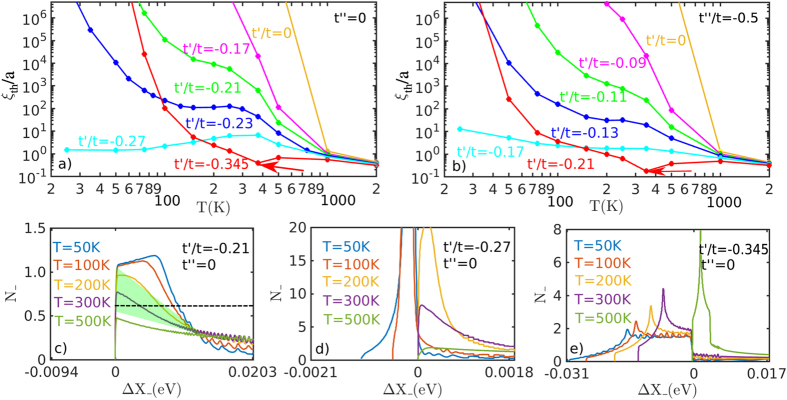
Figure 14. t′ dependence of correlation bottleneck.
(a) ξth for the minimal reference family at several values of t′/t [see legend] and t′′ = 0. (b) ξth for the PA reference family at several values of t′/t [see legend] and t′′ = −t′/2. (c–e) SDOS at t′′ = 0 and three values of t′/t = −0.21 (b) [as in Fig. 13(b)], −0.27 (c), and −0.35 (d). All curves are shifted to line up the (π, π) data at ΔX− = X− − X−(π, π) = 0. Arrows in (a,b) show dip in ξth associated with the commensurate-incommensurate transition.

