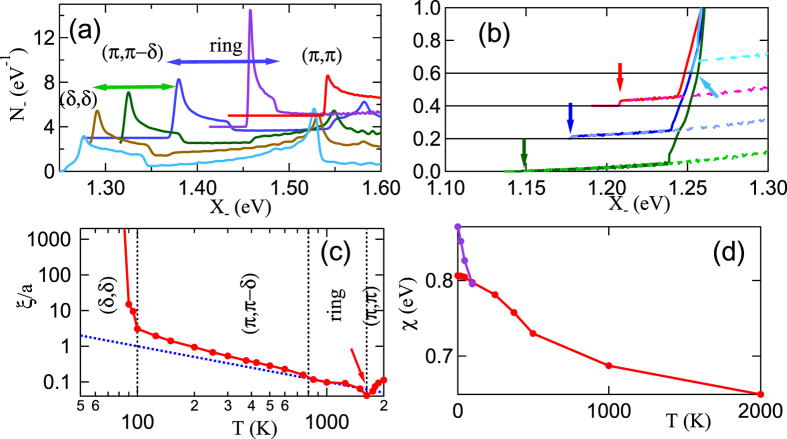
Figure 15. Structures in Bi2201 correlation lengths.
Temperature dependence of: (a) SDOS N− for t − t′ − t′′ reference state of Bi2201, x = 0.20. Datasets are offset for clarity; from highest to lowest, T = 2000 (red), 1000 (violet), 500 (blue), 375 (green), 250 (brown), and 100 K (light blue). (b) Continuation of SDOS in (a) to lower T, showing evolution of the leading edge. From top to bottom: T = 100 (light blue), 50 (red), 25 (blue), and 5 K (green). For each curve, a partial SDOS near the ANN peak is superposed to show the SDOS associated with the ANN peak whose onset is marked by arrows. (c) Correlation length vs T. Blue dotted line represents ξ1/2 ~ T−1. Arrow shows dip in ξ1/2 associated with commensurate-incommensurate transition. (d) Susceptibility of χ(q) peak vs T for q near the (π, π)-plateau (red line) or for ANN nesting (blue line).

