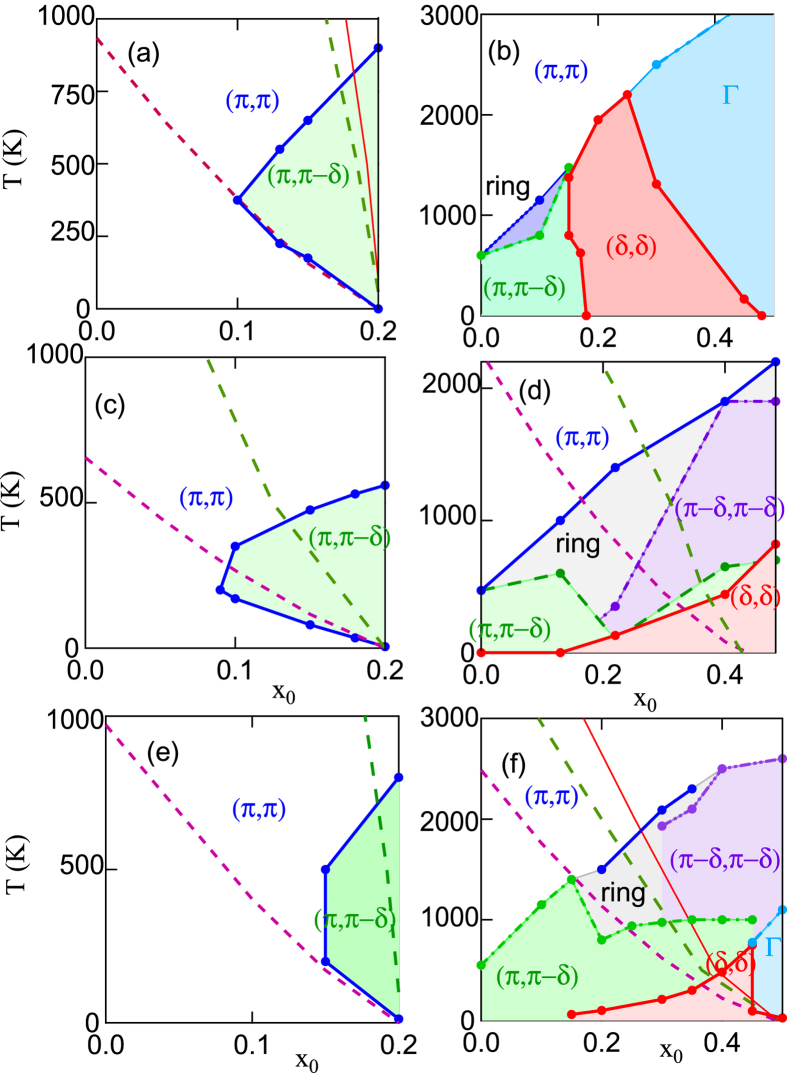
Figure 4. Fluctuation fingerprints of cuprates.
Maps of q-vectors of largest susceptibility for DFT-based models of LSCO (c) and Bi2201 (d) compared to t − t′ − t′′ reference phase a [t′′ = 0] with t′ = −0.23t (a) or −0.43t (b), and reference phase b [t′′ = −0.5t′] with t′ = −0.12t (e) or −0.258t (f). Recall, from Fig. 3, that x0 is the doping at T = 0, but we assume  .
.

