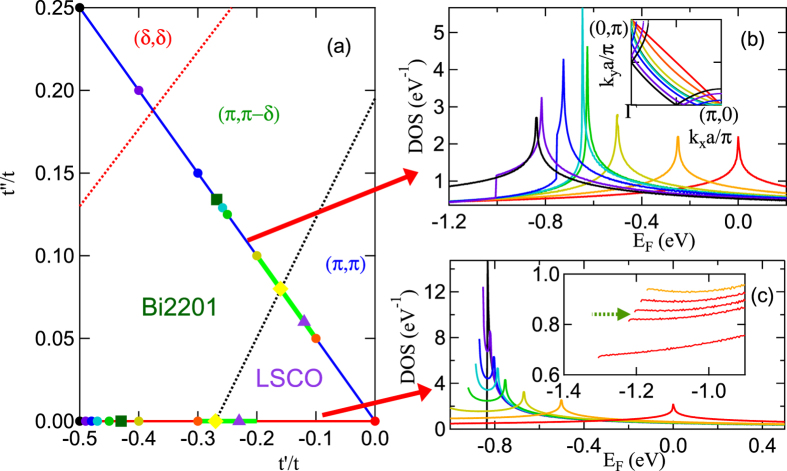
Figure 5. Reference families of the cuprates.
(a) Reference cuts in t′ − t′′-space. Dotted lines indicate ground state transitions at x = 0 (these are meant to be sketches, with only one or two points along the reference lines being determined accurately). Light green line segments indicate the ranges over which ξ is significantly depressed [Results Section (Beyond RPA)] with maximal depression indicated by yellow diamonds. Violet triangles [green squares] mark reference states for LSCO [Bi2201]; colored circles indicate t′-values for the corresponding DOSs in frame (b) [upper line] or (c) [lower line]. (b) DOS for several values of t′ for reference family b (t′′ = −t′/2). As VHS moves from right to left, t′/t = 0 (red curve), −0.1 (orange), −0.2 (yellow-green), −0.25 (green), −0.258 (light blue), −0.3 (blue), −0.4 (violet), and −0.5 (black). Inset: corresponding Fermi surfaces at VHS. (c) DOS for several values of t′ for reference family a (t′′ = 0). As VHS moves from right to left, t′/t = 0 (red curve), −0.3 (orange), −0.4 (yellow-green), −0.45 (green), −0.47 (light blue), −0.48 (blue), −0.49 (violet), and −0.5 (black). Inset: leading edge of DOS, near band bottom for (from bottom to top) t′/t = −0.22, −0.27, −0.28, −0.29, −0.30, in regime where it crosses over from a local minimum to a local maximum.

