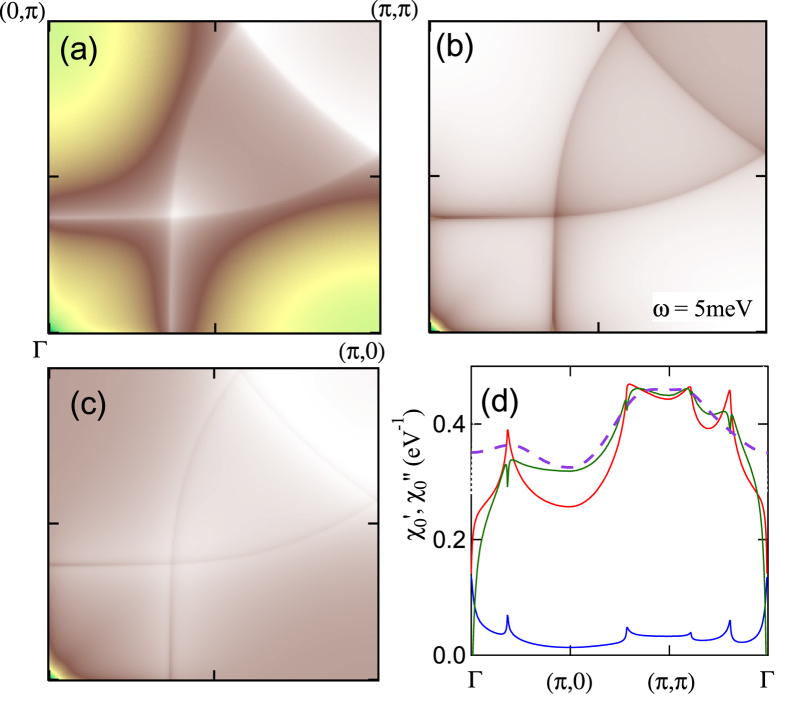
Figure 6. Extracting the bulk χ0 contribution.
(a) Susceptibility χ′0 of Bi2201 for full DFT dispersion and x = 0.13, plotted in first Brillouin zone at T = 0, ω = 5 meV. Color scale from minimum (blue) to maximum (white). (b) As in (a), but for χ′′0. (c) Difference plot of (a) and the scaled version of (b). (d) Cuts of susceptibility from earlier frames plotted along high symmetry lines, with red curve representing data in frame (a), blue curve for frame (b), and green curve for frame (c). Shown also is the curve corresponding to frame (a), but at T = 1000 K (violet long-dashed line) scaled by 1.4 and shifted by −0.045 eV−1 to match other curves near (π, π).

