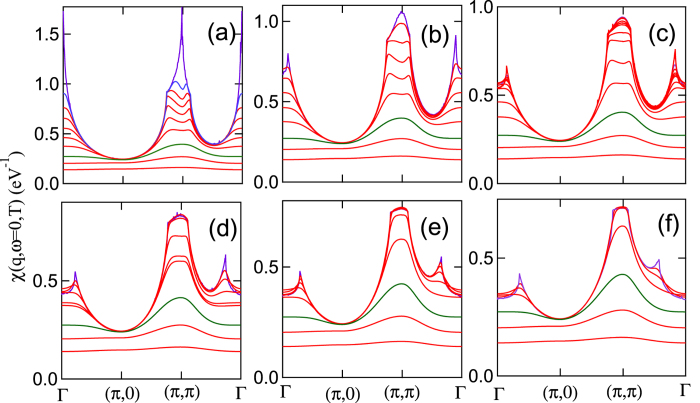
Figure 9. Coherent-incoherent crossover at x = 0 in χ0(T).
Lindhart susceptibility χ′(q,ω = 0) of LSCO, plotted along high-symmetry lines at 6 different dopings: (a) x = 0.20 (~VHS), (b) x = 0.18, (c) x = 0.15, (d) x = 0.10, (e) x = 0.05, and (f) x = 0, at (from top to bottom) T = 0, 10, 25, 50, 100, 200, 400, 1000, 2000, and 4000 K, except that in frames (d) and (f) the traces at T = 10 and 25 K are omitted. The T = 1000 K susceptibility is plotted as a green line.

