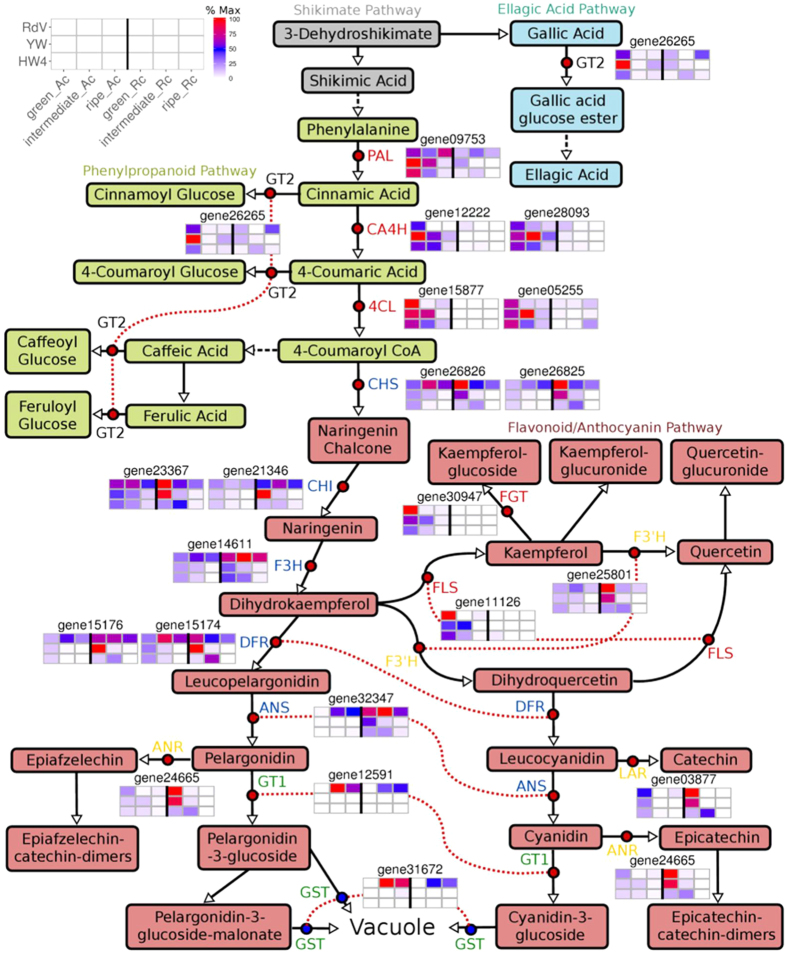
Figure 5. Schematic illustration of the shikimate, ellagic acid, phenylpropanoid, flavonoid and anthocyanin pathway.
Red dots indicate biochemically characterized enzymes in strawberry fruit: ANS, anthocyanidin synthase; ANR, anthocyanidin reductase; CA4H, cinnamic acid 4-hydroxylase; CHI, chalcone isomerase; CHS, chalcone synthase; 4CL, 4-coumaroyl-CoA ligase; DFR, dihydroflavonol reductase; FGT, flavonoid glucosyltransferase; F3H, flavanone 3-hydroxylase; F3′H, flavonoid 3′-hydroxylase; FLS, flavonol synthase; GT1, anthocyanidin glucosyltransferase; GT2, (hydroxy)cinnamic acid and (hydroxy)benzoic acid glucosyltransferase; LAR, leucoanthocyanidin reductase; PAL, phenylalanine ammonia lyase. Blue dots indicate putative GST, glutathione S-transferase. Identical genes are connected by a dotted red line when adjacent. Enzymes shown in the same color are co-regulated. Heatmaps show relative transcript levels (% Max) of genes in receptacle (Rc) and achenes (Ac) of F. vesca RdV, YW, and HW4 at the green, intermediate and ripe developmental stage.

