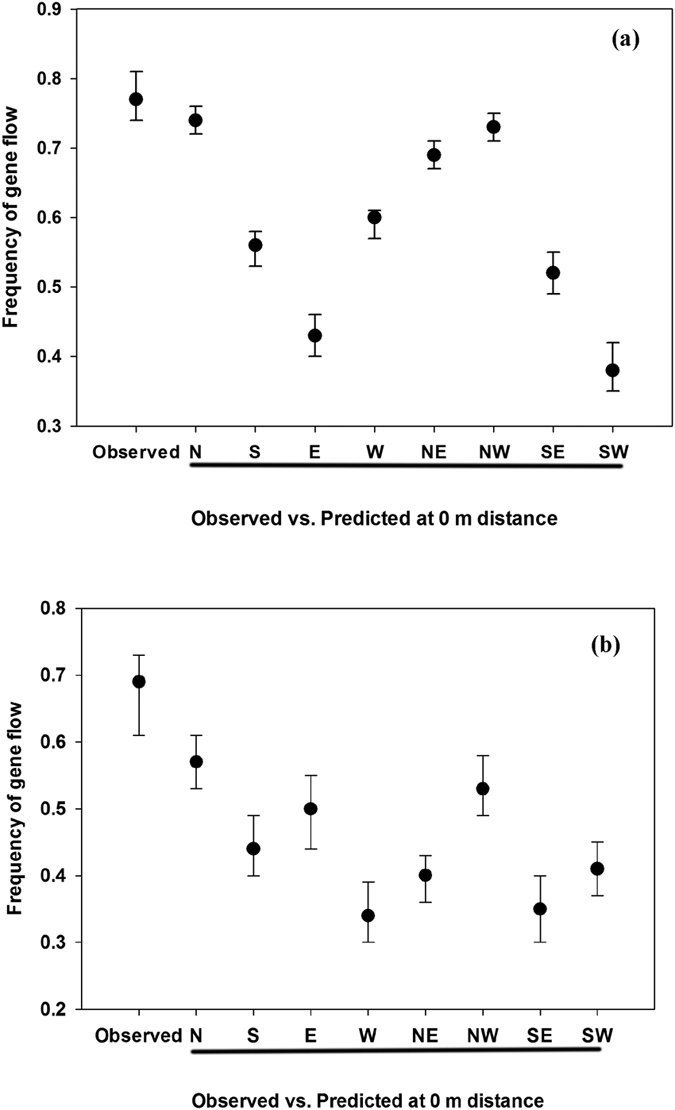
Figure 4. Gene flow frequency at 0 m was predicted using the final model [equation (6)] and compared with the observed frequency at that distance (0 m).

Frequency of gene flow (observed and predicted) from (a) 2013 and (b) 2014 was plotted and the bars above and below each data point indicate a 95% confidence interval.
