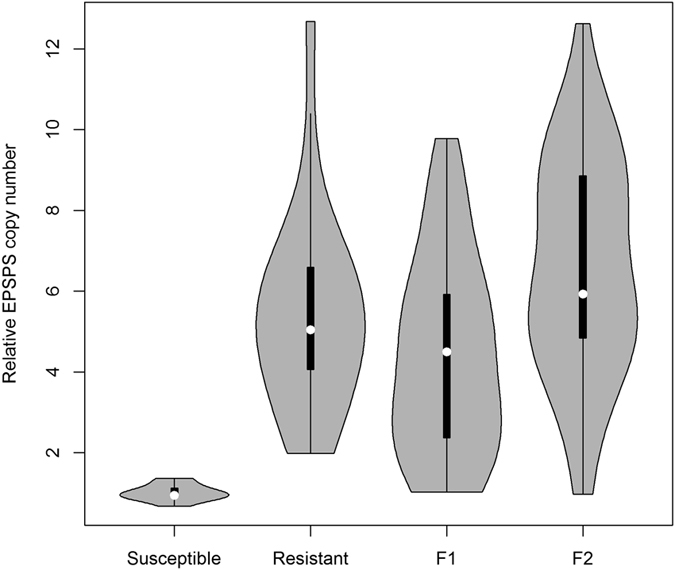
Figure 5. Violin plots combining a boxplot and a kernel density plot to present the distributions of relative EPSPS gene copy number in four populations (glyphosate-susceptible and -resistant parents, F1, and pseudo-F2).

The white dot at the center of the boxplot shows the median of the relative EPSPS gene copy number.
