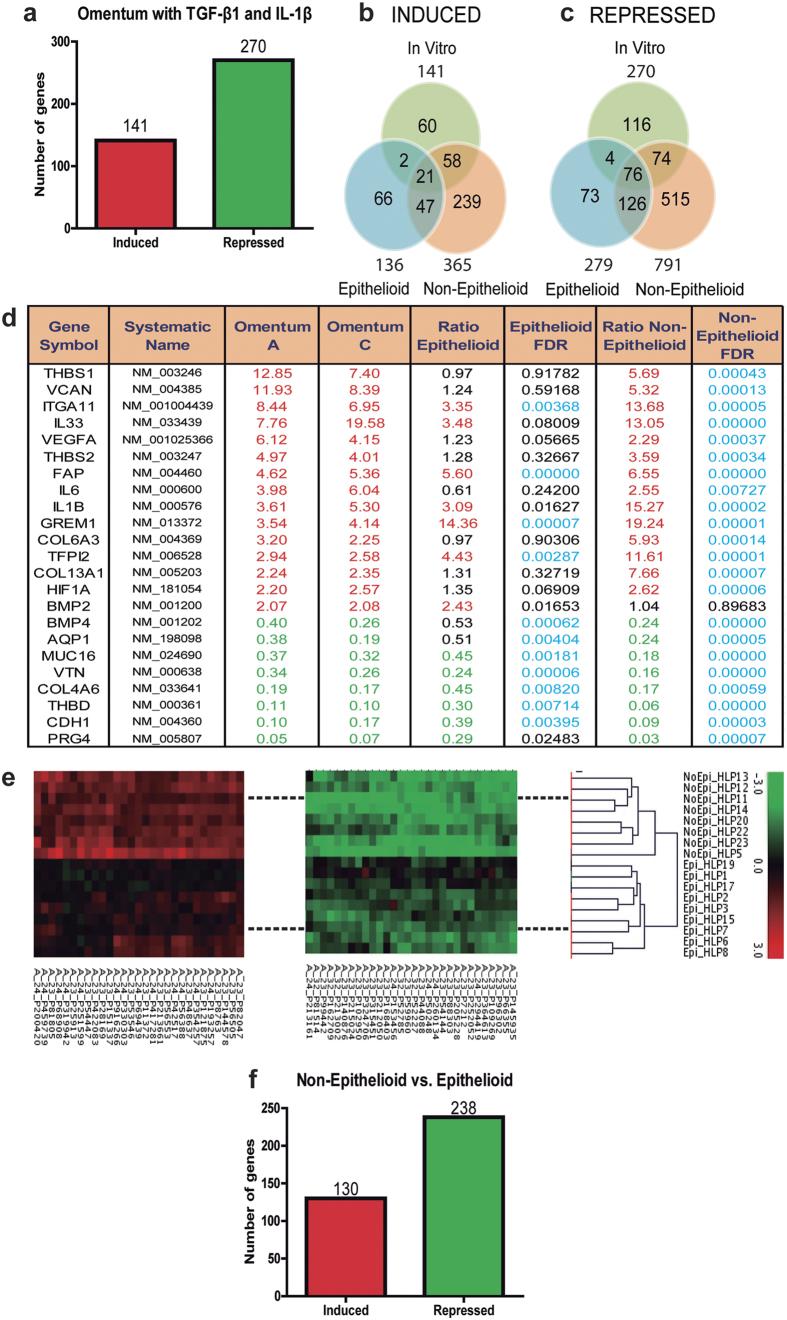
Figure 1. Microarray analysis.
(a) Number of repressed genes is higher than induced genes in omentum-derived MCs treated with TGF-β1 and IL-1β. Untreated omentum-derived MCs were used as control. (b) Induced and (c) repressed genes in effluent-derived MCs indicate that repressed genes are higher than induced and the differential gene expression is greater in Non-Epithelioid phenotype compared to Epithelioid and partial overlapping was observed between ex vivo and in vitro models. (d) Overlapping genes in in vitro and ex vivo models. MCs from Omentum A and C were treated with TGF-β1 and IL-1β and compared with the untreated omentum-derived MCs. Ratios in Non-Epithelioid and Epithelioid depict the expression change in effluent-derived cells, with a respective FDR associated. In red: induced genes; in green: repressed genes; and in blue: statistically significant results. (e) Gene fingerprint of effluent-derived MCs grouped correctly the samples using cell phenotype by cluster analysis. (f) Number of repressed genes is higher than induce genes when Non-Epithelioid phenotype was compared with Epithelioid phenotype.

