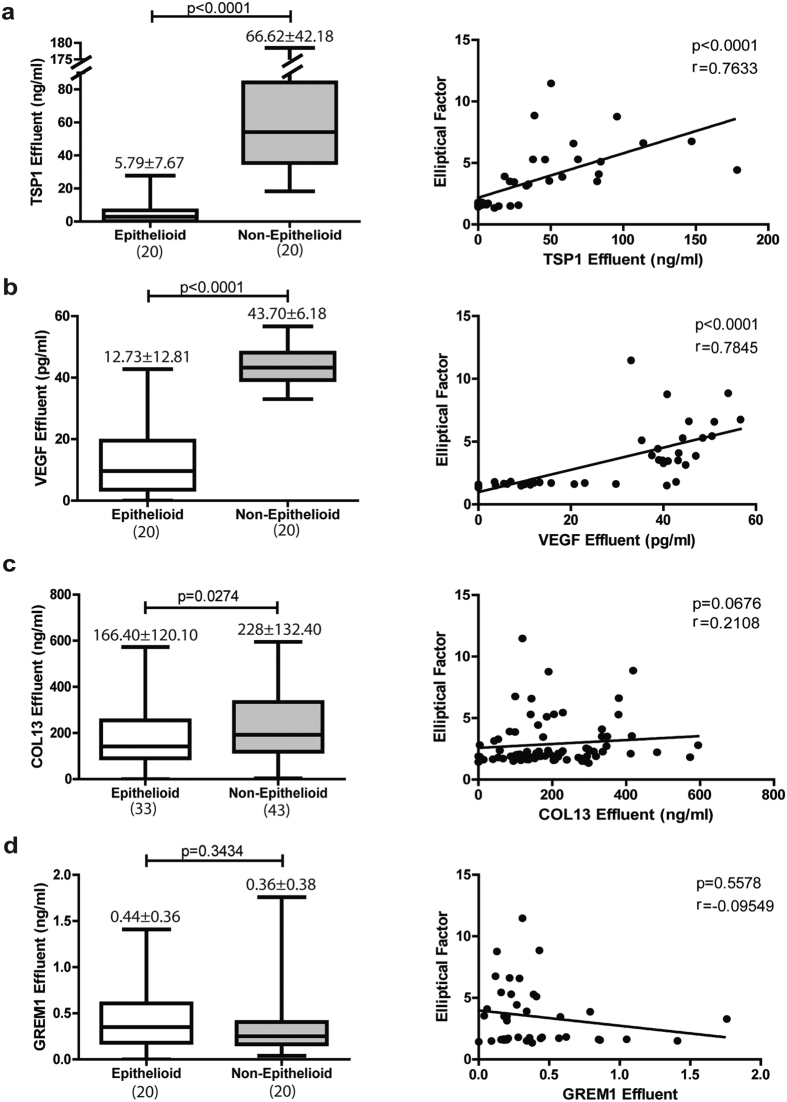
Figure 4. Proteins in effluents by Elliptical Factor.
(a) TSP1, (b) VEGF, (c) COL13 and (d) GREM1 were measured in effluents. Left panels represent level of proteins grouped by cell phenotype and right show correlations between protein in effluent and Elliptical Factor. Number on top box-plot represents the mean ± standard deviation. Whiskers in box-plot represent maximum and minimum values. Number in parentheses represents the N of each group. Results were significant with p < 0.05 (Mann-Whitney test and Spearman correlation).

