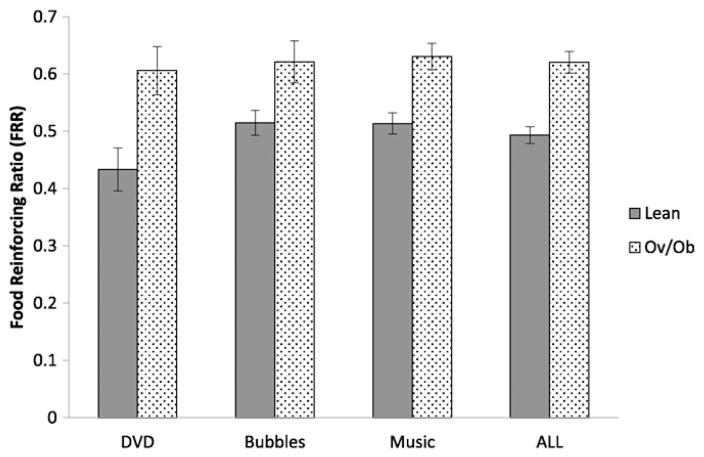
Fig. 1.
Infant obesity status in relation to food/non-food reinforcement. Infants aged 9–18 months old performed the developmentally appropriate food/non-food reinforcement task in three different studies using three different types of non-food reinforcers [Study 1: watching Baby Einstein-Baby MacDonald™ (DVD), lean n = 18, overweight and obese (Ov/Ob) n = 9; Study 2: playing with bubbles (Bubbles), lean n = 17, Ov/Ob n = 13; Study 3: music engagement (Music), lean n = 37, Ov/Ob n = 12]. In the integrated sample, there were 72 lean and 34 Ov/Ob infants. Reinforcing values of food and non-food alternatives were determined using the maximum schedule achieved for food (Food Pmax) and non-food alternative reinforcer (ALT Pmax). Food reinforcing ratio (FRR) was determined by calculating proportion of food responses among all responses [Food Pmax/(Food Pmax + ALT Pmax)]. Linear regression model shows that Ov/Ob infants had significantly higher FRR-DVD (Lean: 0.43 ± 0.04 [mean ± SEM], Ov/Ob: 0.61 ± 0.05; p = 0.009), FRR-Bubbles (Lean: 0.51 ± 0.03, Ov/Ob: 0.62 ± 0.03; p = 0.01) and FRR-Music (Lean: 0.51 ± 0.02, Ov/Ob: 0.63 ± 0.03; p = 0.002). Similarly, when all three studies were combined the pattern of responding between lean vs. Ov/Ob infants remained consistent (Lean: 0.50 ± 0.01, Ov/Ob: 0.62 ± 0.02; p < 0.0001).

