Figure 4.
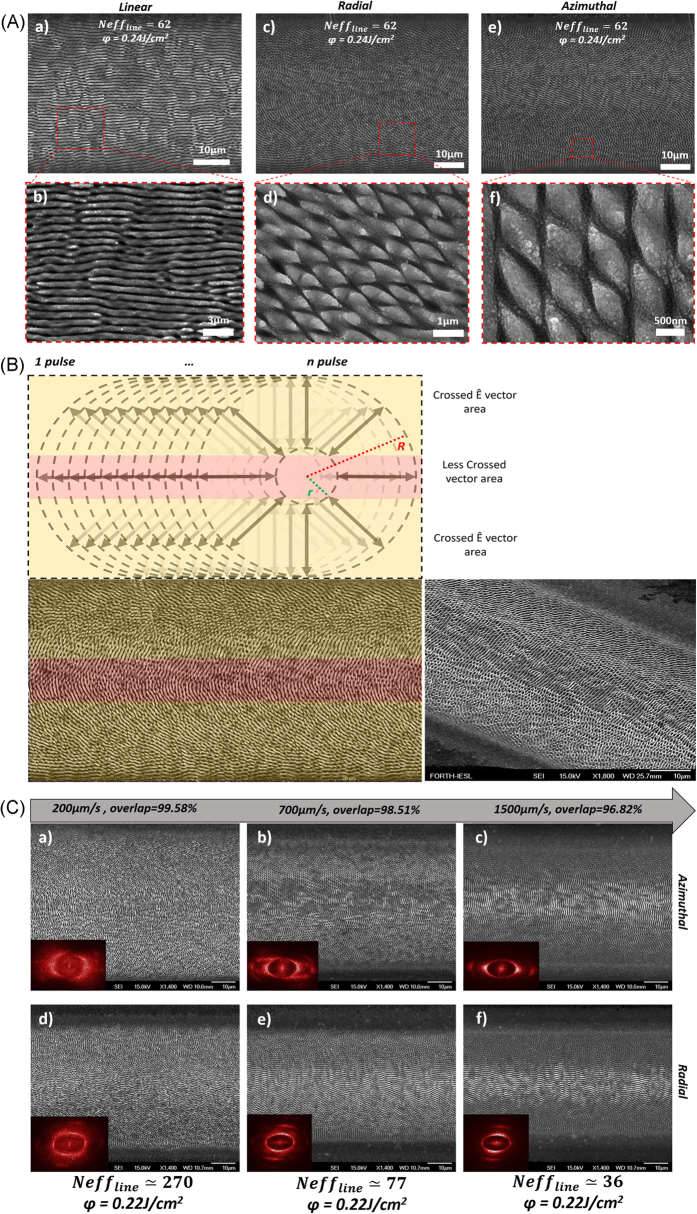
(A) Top-view SEM images depicting line scans produced by linearly (a,b), radially (c,d), and azimuthally polarized (e,f) beams, respectively, at v = 0.5 mm/s (Neffline = 62), and φ = 0.24 J/cm2. The images (b,d,f) are higher magnifications of an area inside the red-dashed-squares and reveal the biomimetic shark skin-like morphology of the processed areas; (B) Schematic of the beam overlap process during a linescan with a CV beam; a typical linescan SEM image is shown for comparison; (C) SEM images of linescans produced by azimuthally (a,b,c) and radially (d,e,f) polarized CV beams of a constant fluence, φ = 0.22 J/cm2, at different scanning speeds. The corresponding 2D-FFT images are shown as insets.

