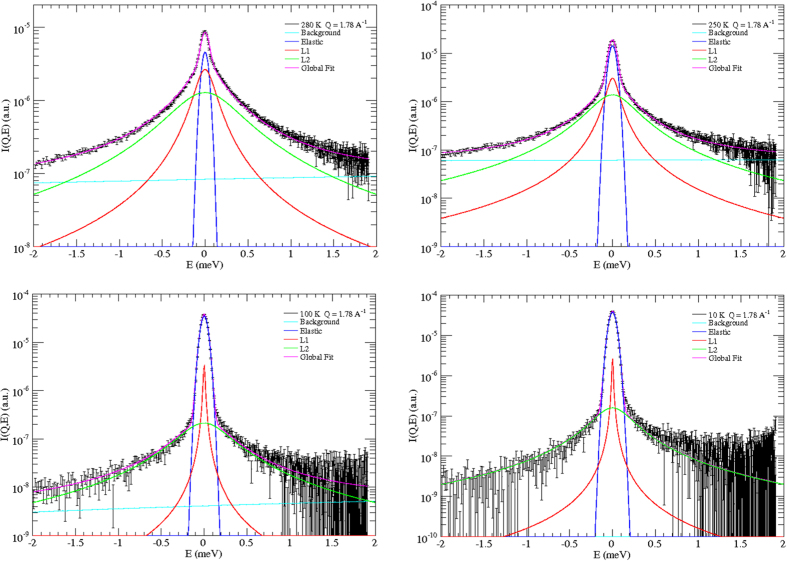
Figure 3. Examples of global results of data fitting to Eq. (1) (magenta line) at 280, 250, 100, and 10 K, and at Q = 1.78 Å−1.
The elastic peak (blue line) has the same shape of the resolution function. L1 (red line) refers to the translational Lorentzian term in Eq. (1) (first Lorentzian in Eq. (2)). L2 (green line) refers to the roto-translational term (second Lorentzian in Eq. (2)). The background contribution is reported in light blue. At this Q-value the weight of the Bessel function  is dominant when compared to
  , so increasing the weight of the roto-translational term with respect to Fig. 2.

