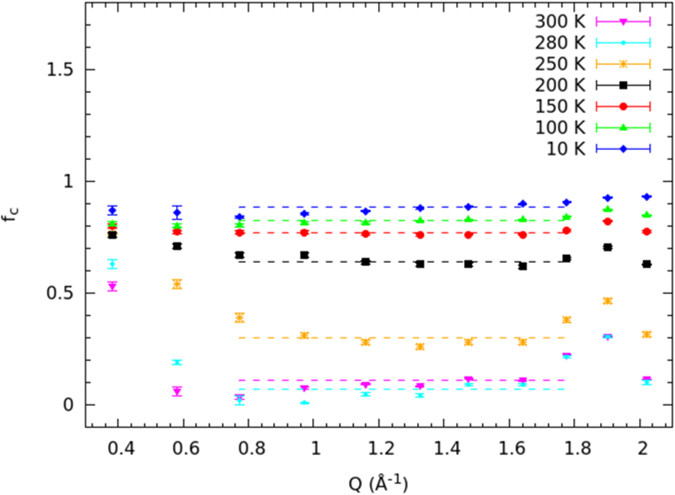
Figure 8. The fC(Q) distribution at the investigated temperatures as obtained from the fit toEq. (1).

The dashed lines are the average values obtained at Qs ranging from 0.77 to 1.78 Å−1.

The dashed lines are the average values obtained at Qs ranging from 0.77 to 1.78 Å−1.