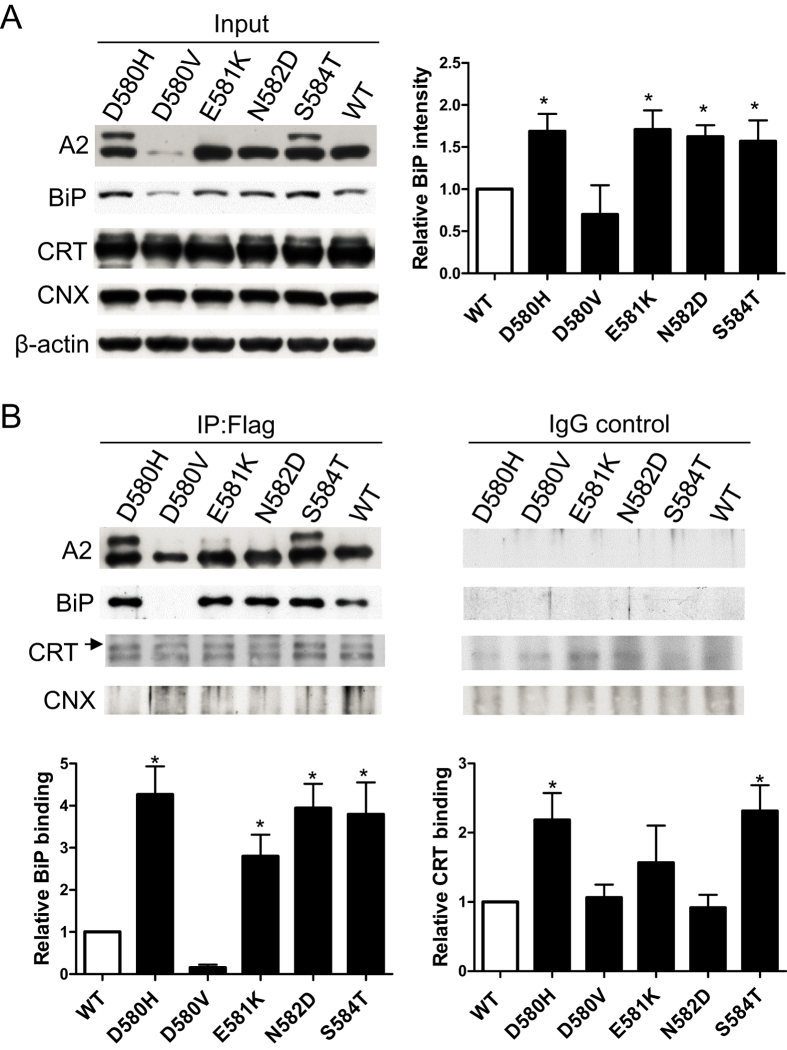
Figure 6. Inductions of ER chaperones and increased interaction with BiP by selected A2 mutants.
(A) Thirty-six hours after transfection, cell extracts were analyzed by immunoblotting with the indicated antibodies. CRT: calreticulin, CNX: calnexin. BiP intensities were densitometrically quantified and expressed as fold changes compared to WT after normalizing to the β-actin loading control (data are mean ± SEM, n = 2. *P < 0.05). (B) Thirty-six hours after transfection, cell extracts were immunoprecipitated with mouse monoclonal anti-Flag antibody or normal mouse IgG. The immunoprecipitates were analyzed by immunoblotting with the indicated antibodies. The amounts of BiP and CRT that co-immunoprecipitated with A2 domain mutants were densitometrically quantified and expressed as fold changes relative to WT (data are mean ± SEM, n = 3. *P < 0.05).

