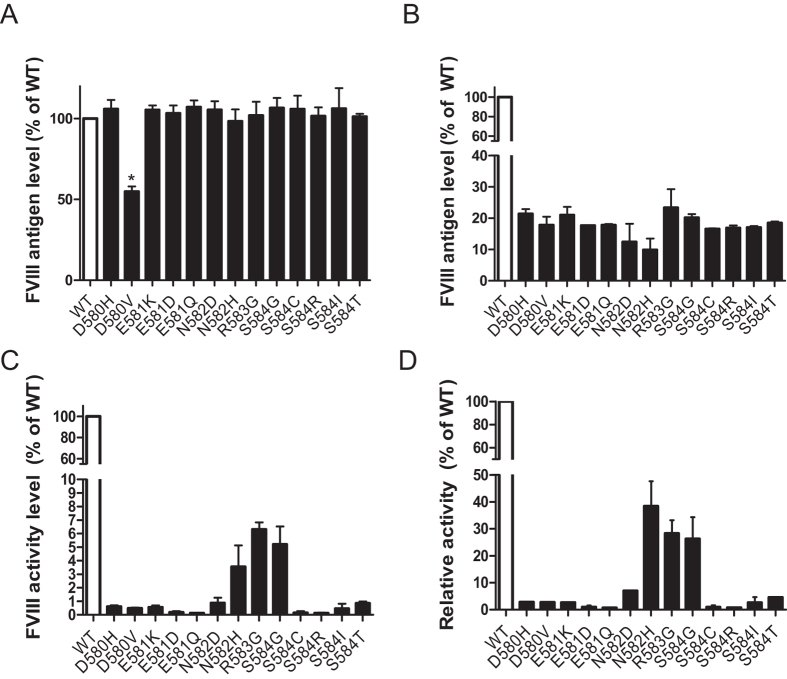
Figure 7. Antigen and activity levels of full-length FVIII mutants.
(A) and (B) Forty-eight hours after transfection, FVIII antigen levels in cell extracts (A) and conditioned media (B) were analyzed by ELISA. Antigen levels of FVIII mutants were plotted as percentages of WT FVIII (data are mean ± SEM, n = 3). Only the level of D580V mutant was significantly reduced comparing to WT FVIII (*P < 0.05). (C) Forty-eight hours after transfection, activity levels of FVIII in conditioned media were analyzed by a chromogenic assay. The averages of mutants were plotted as percentages of WT FVIII activity (n = 3). Activities of all the mutants were significantly reduced compared to WT FVIII (P < 0.05). (D) Relative activity for a given mutant was calculated as the ratio of the activity level and the antigen level in conditioned media, plotted as percentages of the WT FVIII relative activity. Relative activities of all mutants were significantly reduced compared to WT FVIII (P < 0.05).

