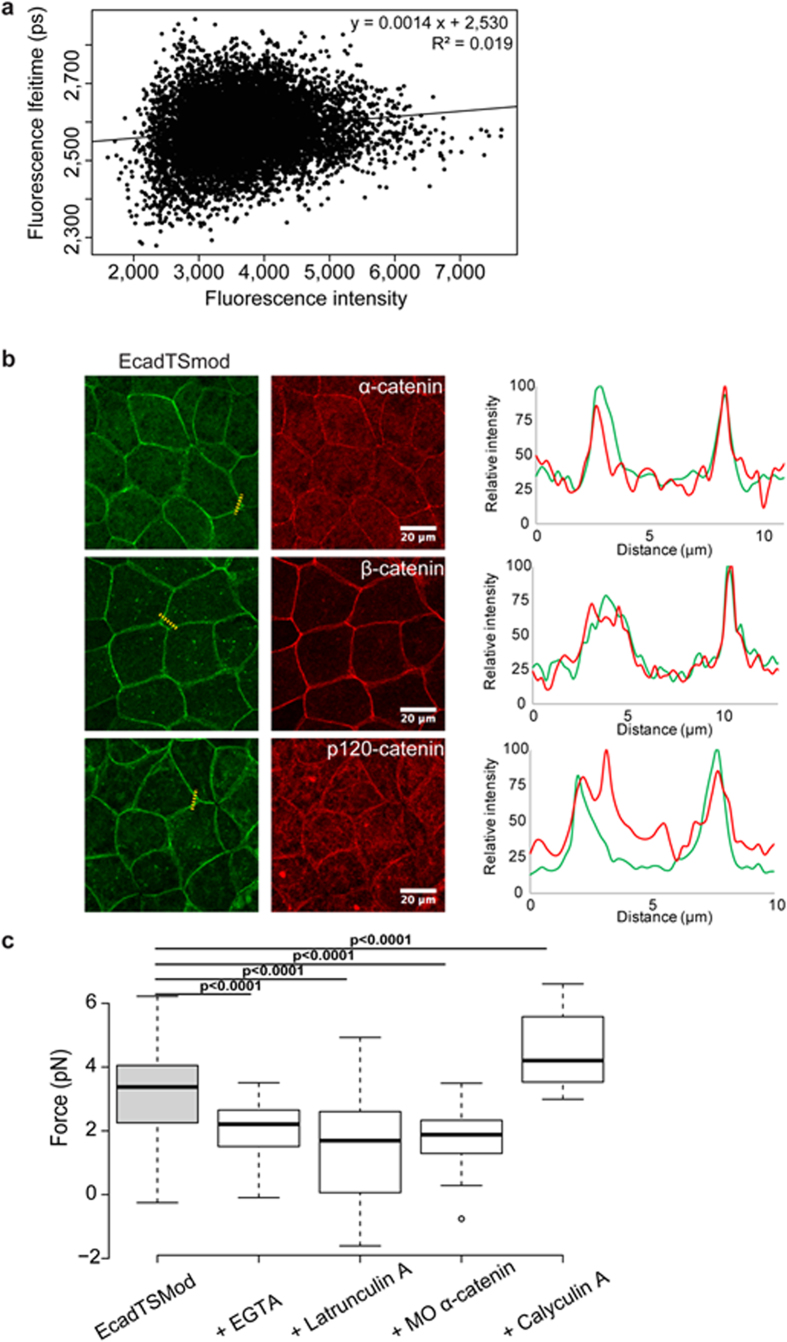
Figure 3. EcadTSMod biosensor is integrated into the adherens junction and responds to several treatments.
(a) Scatter plot of the fluorescence lifetime vs fluorescence intensity for each pixel of a representative acquisition. Equation of the linear regression is specified in the top right corner. (b) Indirect immunofluorescences of EcadTSMod detected with anti-GFP antibody (green) and α, β and p120 catenins (red) in Xenopus laevis blastula overexpressing the EcadTSMod protein. Linescan were made on the indicated dotted line, and the normalized fluorescence intensity is shown for both channel (green for EcadTSMod and red for catenins) in the corresponding graph. Scale bar, 20 μm. (c) Boxplot of mean forces applied on EcadTSMod in untreated embryos or embryos treated with EGTA, latrunculin A, morpholino against α-catenin (MO α–catenin) and Calyculin A, with respectively 105, 32, 37, 44 and 29 independent fields (respective number of experiments: 14, 2, 2, 2 and 3; respective number of embryos: 55, 16, 19, 22 and 15). For each comparison, the p value is indicated. In the box plot, bold bars correspond to median value, whiskers to the value 1.5x away from the 1st and 3rd quartiles, and the dot to outlier.

