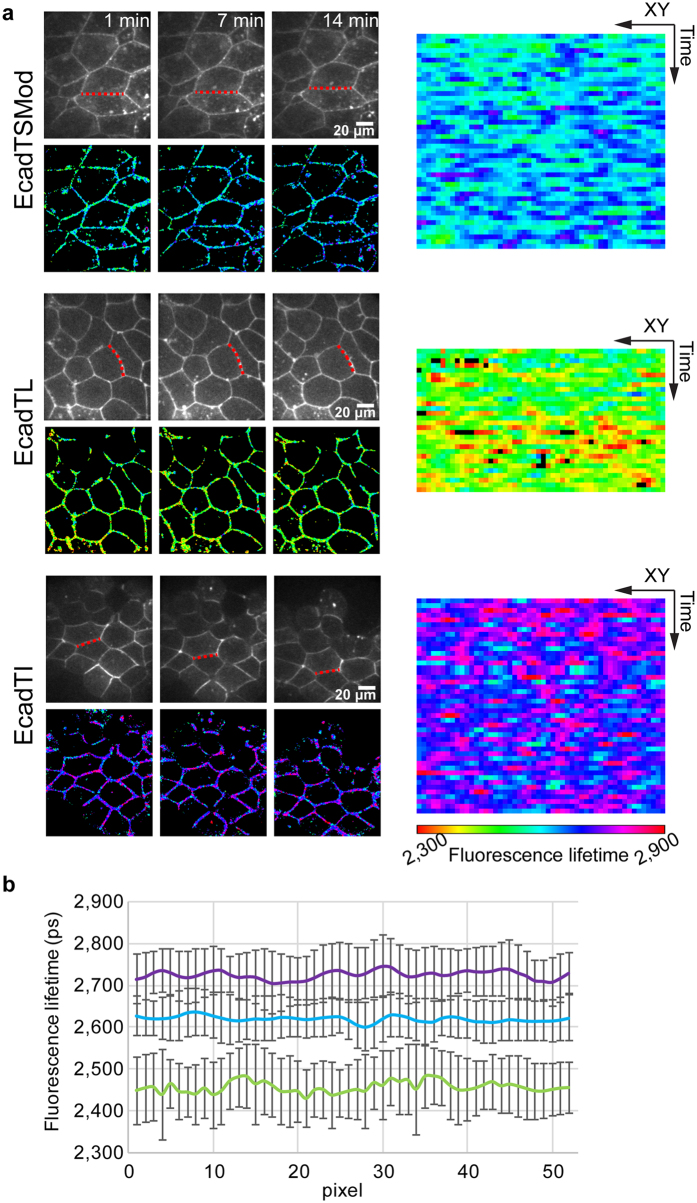
Figure 4. Spatio-temporal analysis of E-cadherin biosensor in the Xenopus embryo.
(a) Temporal acquisition of EcadTSMod, EcadTL and EcadTI in Xenopus blastula. Fluorescence images are presented in the upper row; the lower row corresponds to fluorescence lifetime images. For each construct, 3 time points are presented 1, 7 and 14 minutes. A kymograph of the whole temporal acquisition is represented in the right part, the corresponding XY coordinates are shown by the red dotted line in fluorescence images. (b) Mean fluorescence lifetimes and standard deviations of all XY coordinates over the time series for EcadTI (purple), EcadTSMod (cyan) and EcadTL (green). Values represent the mean ± SD.

