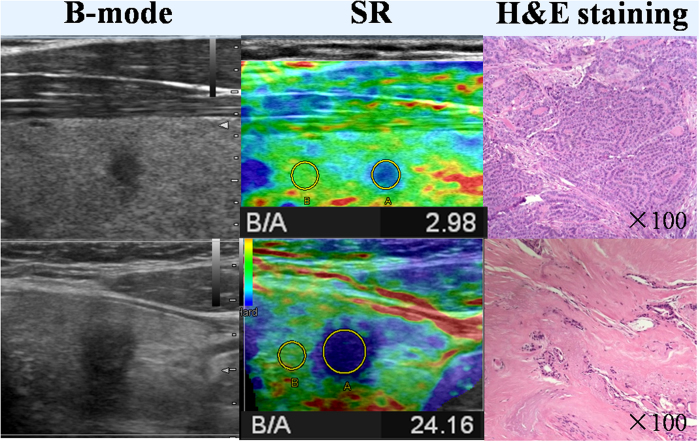
Figure 1. The first row shows the B-mode ultrasonography and histologic image of one PTC. SR of the PTC is 2.98 and the H&E staining slide shows the nodule is cell dominant type.
The second row shows the B-mode ultrasonography and histologic image of another PTC. SR of the PTC is 24.16 and the H&E staining slide shows the nodule is collagen dominant type.

