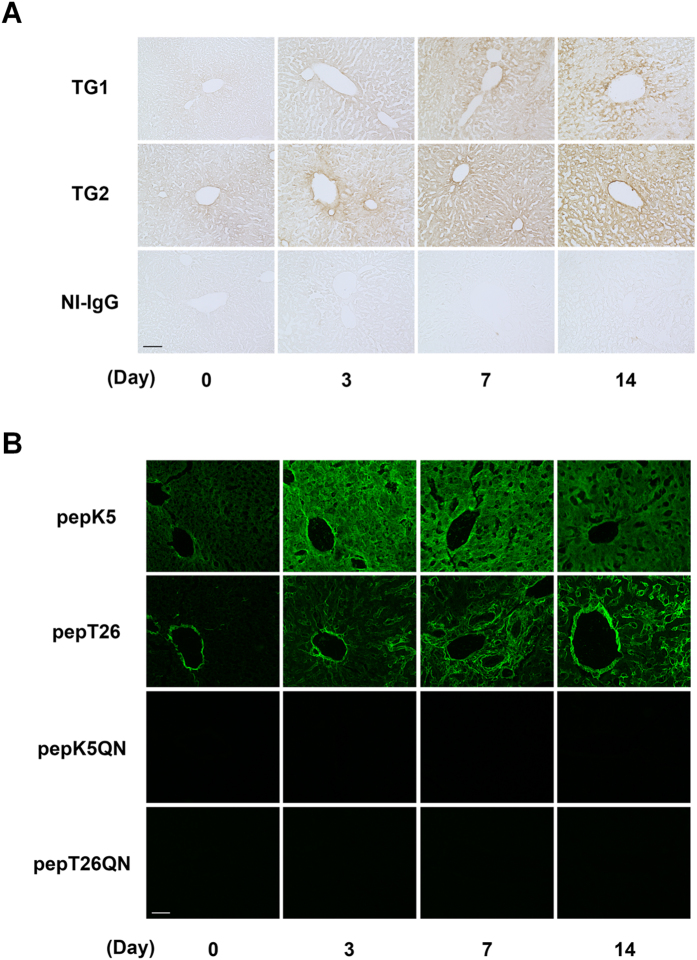
Figure 3. Distributions of the expressions and activities of TG1 and TG2 in fibrotic livers.
Each liver section was subjected to the immunohistochemistry and in situ TG activity staining on the indicated days after BDL surgery (n = 3 mice). (A) Immunostaining was performed using polyclonal anti-mouse TG1 and TG2 antibodies, and rabbit NI-IgG as the negative control. Bar = 100 μm. (B) The in situ activities of TG1 and TG2 were visualized using FITC-labeled substrate peptides (pepK5 and pepT26, respectively). Mutant peptides (pepK5QN and pepT26QN) were used as the negative control. Bar = 50 μm.

