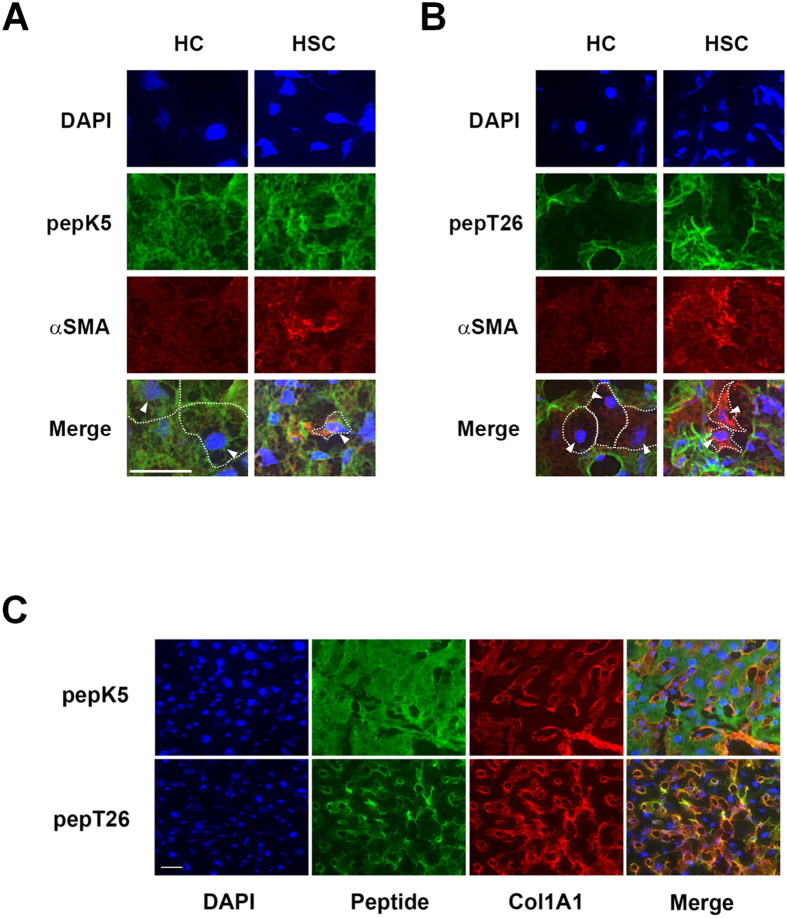
Figure 4. Detailed distribution analysis of the enhanced activity of each TG.
The colocalization of the activity of each TG with the αSMA or collagen in the liver sections was analyzed in the control and at 14 days after BDL surgery. (A and B) The liver sections (n = 3 mice) were incubated with FITC-labeled substrate peptides. Following fixation in 4% paraformaldehyde, the sections were immunostained using anti-αSMA antibody and counterstained using DAPI. Merged staining images are shown in the bottom lane, with arrowhead indicating the nucleus of hepatocyte (HC) and activated hepatic stellate cell (HSC). White dotted lines outline the shape of HC and HSC. Arrowheads indicate the position of the nuclei in these cells. Bar = 50 μm. (C) Merged images for the colocalization of the activity of each TG and collagen deposition are shown. Bar = 50 μm.

