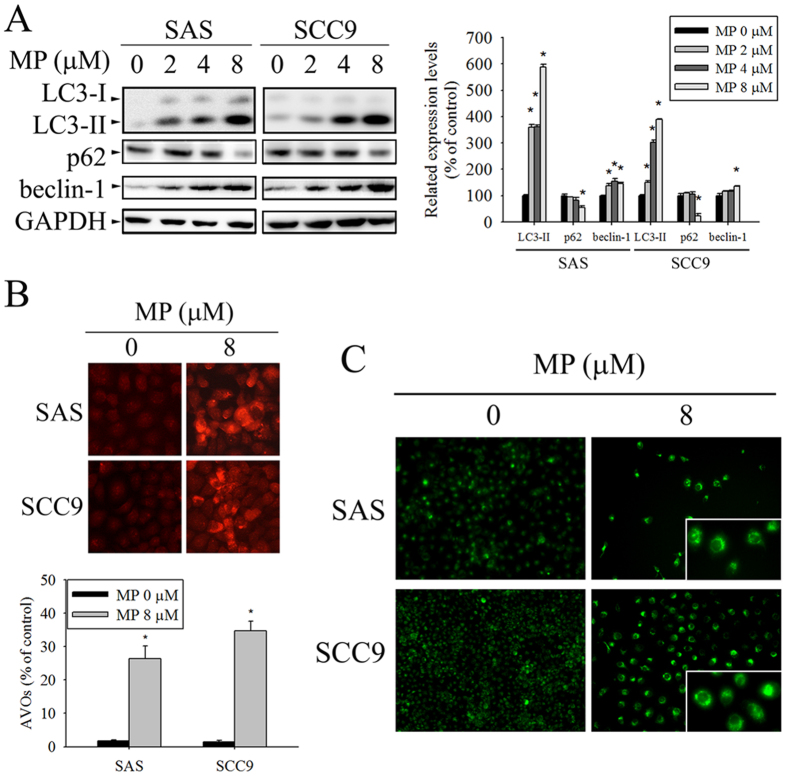
Figure 3. MP induces autophagy in SAS and SCC9 cells.
(A) Cells were treated with indicated concentration of MP for 24 h and the expression levels of LC3-I/LC3-II, p62, and beclin-1 were examined by Western blot (left panel). GAPDH was used as an internal control to normalize the amount of proteins applied in each lane (right panel). (B) Cells were treated with DMSO (control) or 8 μM MP for 24 h, and then were stained with acridine orange (AO) for acidic vesicular organelles (AVOs) formation. An increase in number of cells with accumulating AVOs (orange-red fluorescence) was examined under a fluorescence microscope. The orange-red punctate spots were considered to be AVOs, markers for autophagosomes. The quantification of cell with AVOs was performed using the analyze particles tool of the Image J software on an average of 100 cells (lower panel). (C) Cells were treated with DMSO (control) or 8 μM MP for 24 h, and MDC was added to the medium during the last hour of culture. MDC-stained cells are indication of autophagosome formation. The data show the mean ± SD of at least 3 independent experiments. *P < 0.05, compared with the control (0 μM).

