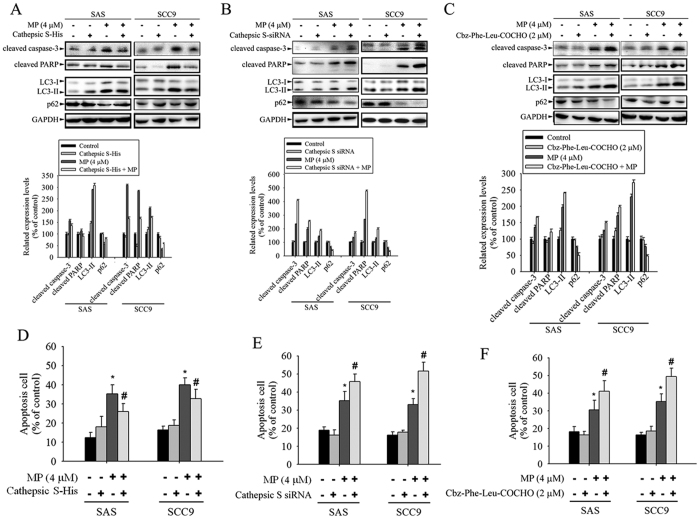
Figure 5. CTSS is involved in MP-induced apoptosis and autophagy in SAS and SCC9 cells.
(A) Cells transfected with or without CTSS expressing plasmid for 24 h were either untreated or treated with MP (4 μM) for another 24 h. (B) Cells transfected with or without CTSS siRNA for 24 h were either untreated or treated with MP (4 μM) for another 24 h. (C) Cells were pretreated with the indicated inhibitors for 4 h and then cultured with or without MP (4 μM) for 24 h. Equivalent amounts of total cell lysates were subjected to Western blot with the indicated antibodies (cleaved caspase-3, cleaved PARP, LC3-I/LC3-II, and p62). The relative density of the bands was quantified by densitometry analysis. Data are presented after normalization with the GAPDH bands. (Bottom panel) (D–F) The percentages of apoptotic cells were evaluated for apoptosis cell content using flow cytometry. Values represent the mean ± SD of 3 independent experiments. *P < 0.05, compared with the control (cells treated with DMSO only). #P < 0.05, compared with cells treated with MP (4 μM) alone.

