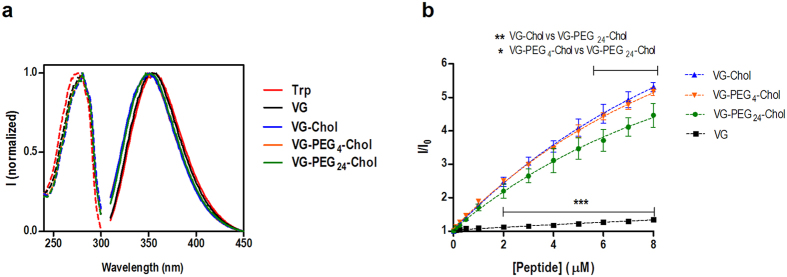
Figure 4. Spectroscopic characterization of VG peptides.
(a) Environmental effects on the tryptophan residue of VG peptides. Normalized fluorescence excitation (dashed line) and emission (solid line) spectra of each peptide and Trp in HEPES buffer 10 mM pH 7.4 in NaCl 150 mM. (b) Concentration-dependent aggregation of the VG peptides, evaluated by ANS (12.8 μM) fluorescence intensity (λexc = 369 nm; emission spectra integrated from 400 to 600 nm). The values are means ± standart error of the mean (±s.e.m) of at least three experiments. Statistical analysis was performed using a 2-way ANOVA test (*P < 0.05; **P < 0.01; ***P < 0.001).

