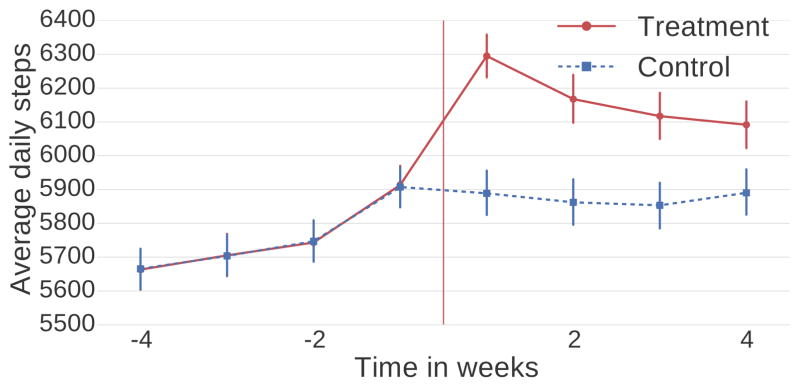
Figure 11.
Average daily steps for users that do join the social network at time zero (treatment; red) and matched users that do not (control; blue). We observe a significant boost in activity in treatment users but no difference in control users. The effect size is practically identical with Figure 4.

