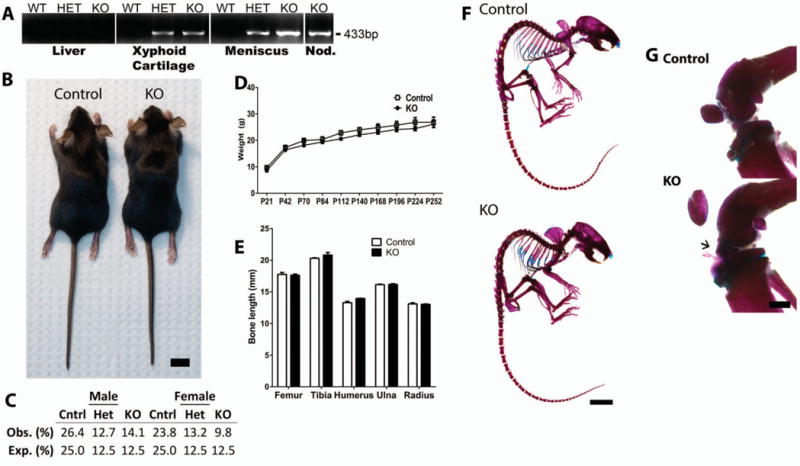
Figure 1.

Normal skeletal development in cartilage-specific mitogen-specific gene 6 (MIG-6)–knockout (KO) mice and control mice. A, Presence of 433-bp polymerase chain reaction product (indicating recombination) only in joint tissues, but not control tissues (such as the liver), from heterozygous (HET) and KO mice as compared with wild-type (WT) control mice. Nod. = nodule (ectopic growth). B, Photograph of representative 28-day-old (postnatal day 28 [P28]) female control and KO mice used in the studies. Bar = 1 cm. C, Observed (Obs.) genotype frequencies of male and female weanling (P21) mice, showing no statistically significant difference from expected (Exp.) values (P = 0.280), by chi-square test. D, Changes in the weights of mice from P21 to P252, showing no statistically significant differences. E, Lengths of long bones obtained from 40-day-old mice, showing no statistically significant differences. Values in D and E are the mean ± SEM. F, Representative alizarin red/Alcian blue–stained skeletons of 40-day-old mice. Bar = 1 cm. G, Alizarin red/Alcian blue–stained knee joints from 40-day-old mice, showing normal joint morphology but abnormal staining of the tissue anterior to the meniscus (arrow) in the KO mouse. Images are representative of 5 or more mice per group. Bar = 1 mm.
