
Figure 2.
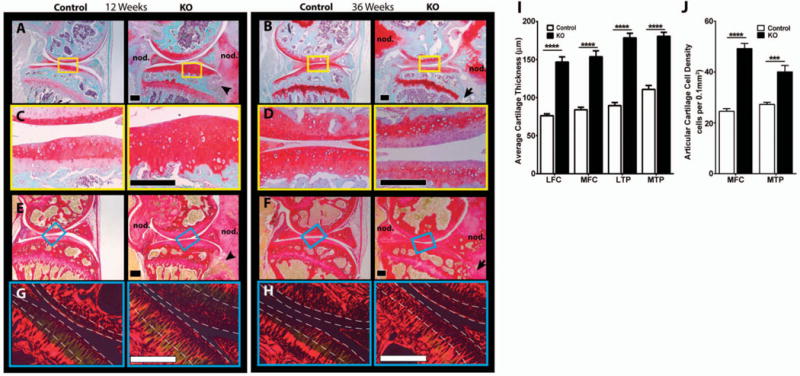
Histologic evaluation of knee articular cartilage in 12-week-old and 36-week-old cartilage-specific mitogen-specific gene 6–knockout (KO) mice and control mice. A–D, Safranin O–fast green–stained sagittal sections of knee joints from 12-week-old (A and C) and 36-week-old (B and D) mice show large chondro-osseous nodules (nod.) and bone infiltration (arrowhead and arrow) in the KO mice. Images in C and D are higher-magnification views of the boxed areas in A and B, respectively. E–H, Picrosirius red–stained sagittal sections of the knee joints from 12-week-old (E and G) and 36-week-old (F and H) mice show tissue infiltrating into bone (arrowhead and arrow) in the KO mice. Images in G and H are higher-magnification views of the boxed areas in E and F, respectively, under polarized light. Areas between the broken lines mark superficial and mid-zone cartilage. Images are representative of 5 mice per group. Bars = 200 μm. I, The average thickness of the articular cartilage in the lateral femoral condyle (LFC), medial femoral condyle (MFC), lateral tibial plateau (LTP), and medial tibial plateau (MTP) is significantly increased in the KO mice. J, Cell density in the medial femoral condyle and medial tibial plateau are significantly increased in the KO mice. Values in I and J are the mean ± SEM. *** = P<0.001; **** = P<0.0001 by two-way analysis of variance with Bonferroni multiple comparisons test.