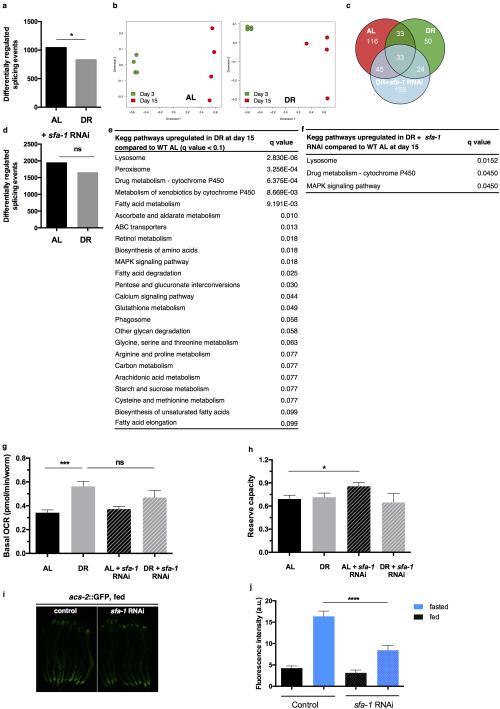
Extended Data Figure 6. Genome-wide effects of DR and SFA-1 depletion on pre-mRNA splicing and metabolism.
a, Differentially regulated splicing events (exons, introns, alternative 5’ and 3’ splice sites) in DR at day 15 compared to AL (p=0.0156, Wilcoxon signed rank test). b, Multidimensional scaling plot of significantly different splicing patterns using inclusion-ratio estimates between day 3 and day 15 old worms (changes in all significant pre-mRNA segments e.g. exons, introns, alternative splice sites considered). c, Venn diagram representing significantly up- or downregulated novel splicing events at day 15 in AL, DR and DR+sfa-1 RNAi (subset of unannotated splice junctions). d, Differentially regulated splicing events (exons, introns, alternative 5’ and 3’ splice sites) with sfa-1 knockdown (AL+ sfa-1 vs. DR+ sfa-1 p=0.7999, Wilcoxon signed rank test). e, KEGG pathways significantly upregulated in DR worm populations at day 15 compared to WT worm populations of the same chronological age with false discovery rate (FDR) of 10%. f, KEGG pathways significantly upregulated in DR worm populations with sfa-1 knockdown at day 15 compared to AL fed worm populations with FDR 10%. Basal respiration (g) and reserve capacity (h) in WT and DR animals (mean ± SEM, *** p ≤ 0.001, *p ≤ 0.05, unpaired two-tailed t-test. Results shown are oxygen consumption rates of day 15 old worms normalized to day 4 old populations, n=100 worms/condition). i, Transcriptional induction of acs-2p::GFP in fed control and sfa-1 knockdown worms (representative image of 2 repeat experiments shown, # worms: ev fed n=83, ev fasted n=77, sfa-1 RNAi fed n=76, 3 sfa-1 RNAi fasted n=84). j, Quantification of acs-2p::GFP after 23 hours of fasting sfa-1 knockdown (mean ± SEM of 2 replicate experiments, p < 0.0001, unpaired two-tailed t-test).

