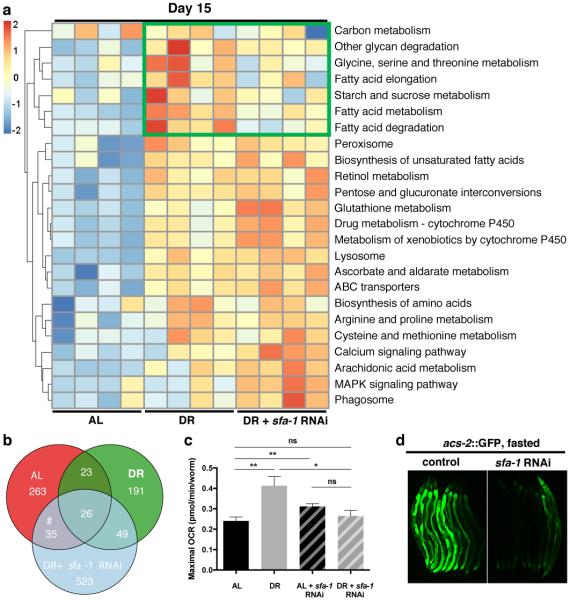
Figure 3. SFA-1 regulates metabolic effects of DR.
a, Heatmap of KEGG analysis in WT AL, DR and DR+sfa-1 RNAi at day 15. b, Venn diagram representing intron inclusion events at day 15 in AL, DR and DR+sfa-1 RNAi (#GO analysis in Supplementary Table 8). c, Maximal respiratory capacity (day 15 normalized to day 4, ** p<0.01, * p<0.05, unpaired, mean ± SEM, two-tailed t-test, n=100 animals/condition). d, Transcriptional induction of acs-2P::GFP in control and sfa-1 knockdown worms after 23 hours of fasting (representative image of 2 experiments shown).

