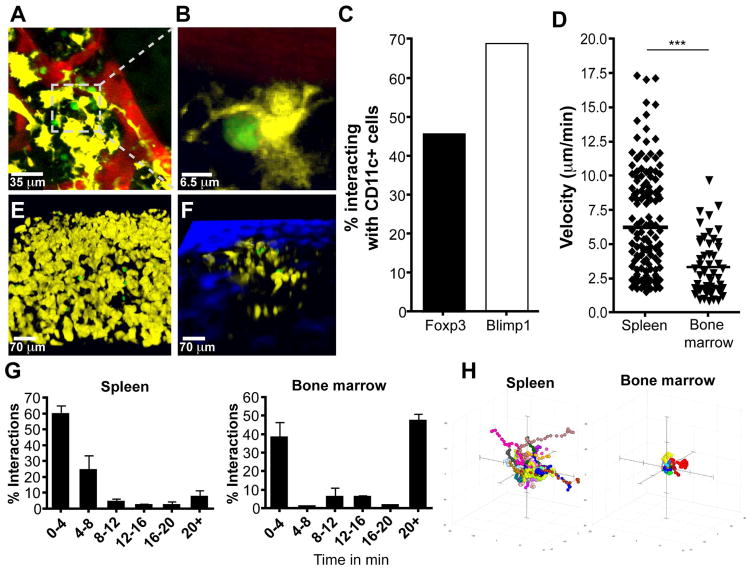
Figure 3.
CD11c-YFP+ cells interact with PC and Treg cells in the BM. (A–C) Intravital imaging of skull BM in BLIMP-GFP/CD11c-YFP dual reporter mice with quantum dot-labeled vasculature (red), with interacting cells highlighted in close up (B). 4 mice were imaged, for a total of 83 BLIMP-GFP cells counted for quantification. (C) Quantification of the percentage of cells observed in interactions between CD11c-YFP+ cells and BLIMP1-GFP+ or Foxp3-GFP+ cells in respective dual reporter mice. (D–H) Imaging and quantification of Treg cell velocity (D) and CD11c+ cell-Treg cell location (E–F) in the spleen and BM of Foxp3-GFP (53 BM Foxp3-GFP cells and 150 splenic Foxp3-GFP cells) (D) or CD11c-YFP/Foxp3-GFP dual (E–G) reporter mice, as well as interaction times between these cells (68 BM Foxp3-GFP cells and 94 splenic Foxp3-GFP cells) (G) and Treg cell movement shown by tracks (H).

