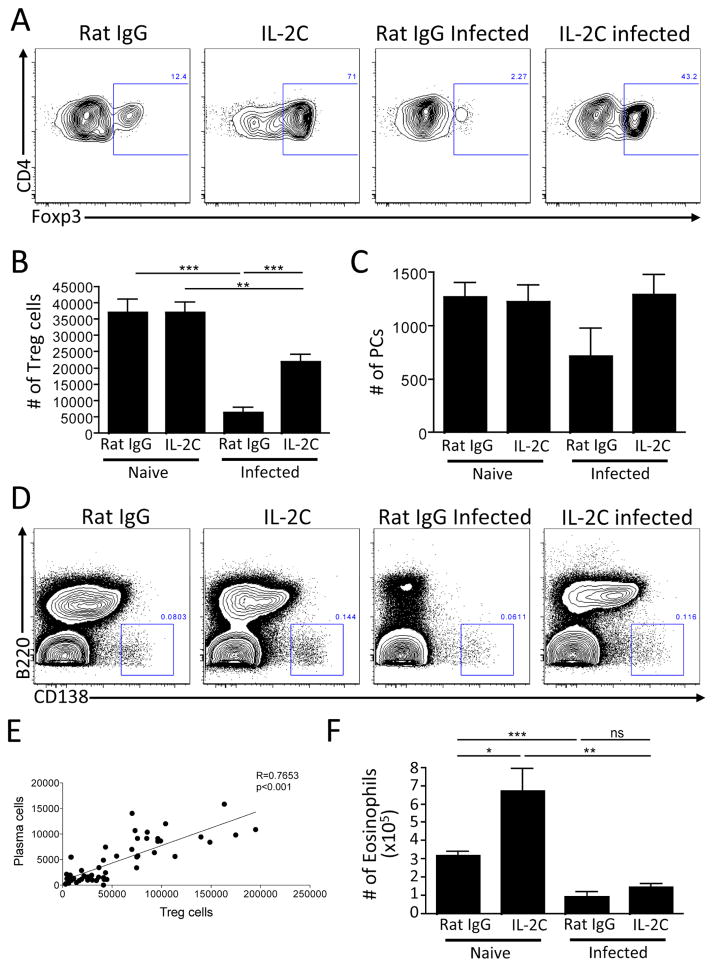
Figure 5.
BM Treg cells support PC maintenance in the BM. (A–F) WT mice were infected with T. gondii and treated with IL-2-anti-IL-2 complex every 3 days for 14 days. BM was evaluated for Treg cells (A–B), PC (C–D), and representative flow plots are shown, with a concatenation of mice within each group for PC plots (D). The numbers of Treg cells and PC were plotted to identify correlations between the cell numbers of these two populations (E). Eosinophils were evaluated and quantified by flow cytometry (F).

