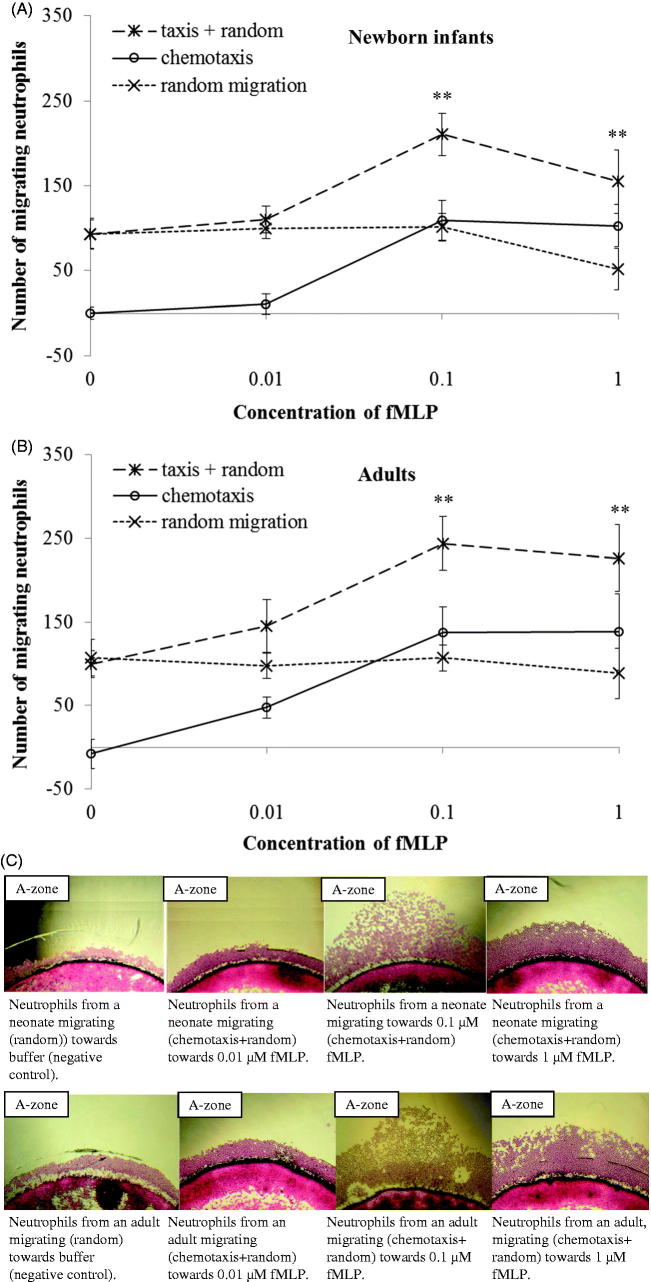
Figure 3.
Dose response curves of migrating neutrophils to gradients of fMLP. Leukocytes from newborn infants (A) (n = 5) and adults (B) (n = 5) were exposed to different concentrations of fMLP (0.01 μM, 0.1 μM, and 1 μM) and buffer. Results are presented as mean ± SEM, and chemotaxis (taxis) was distinguished from random migration (random). C: Example of different patterns of neutrophil migration with 4× magnification, towards buffer (negative control), and gradients of fMLP in one neonate and one adult. At all concentrations of fMLP, a significantly higher number of neutrophils from both neonates and adults migrated towards fMLP than to buffer (**P < .01). Note: ‘random migration’ counted from B-zone; ‘taxis + random’ counted from A-zone; ‘chemotaxis’ calculated from A-zone minus B-zone.

