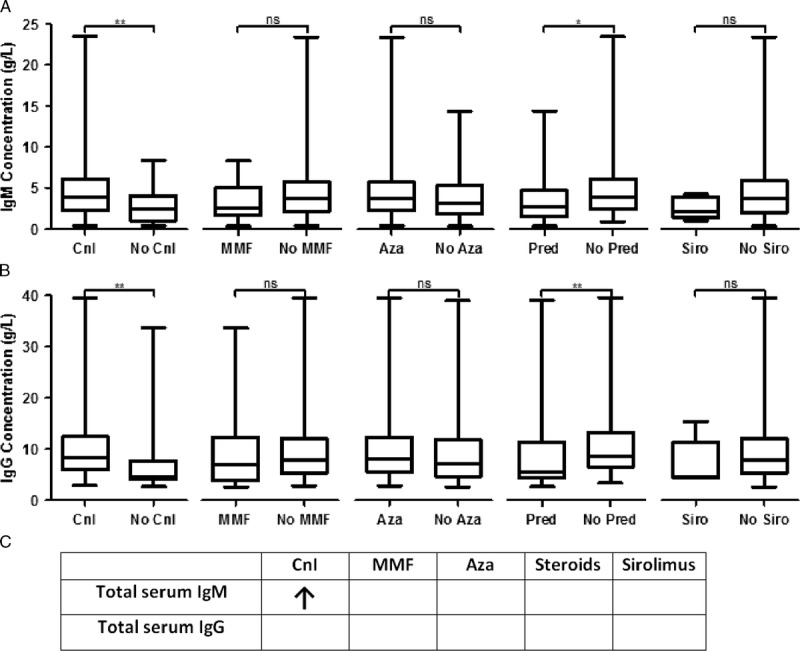
FIGURE 4.

Calcineurin inhibition is associated with increased total serum IgM but not IgG concentration on multivariate analysis. A, Univariate analysis of serum IgM concentration stratified by immunosuppression. B, Univariate analysis of serum IgG concentration stratified by immunosuppression. C, Table of multivariate analysis of effect of immunosuppression on immunoglobulin levels. Results were generated as for Table 4, using log-transformed total antibody concentrations. Significance was taken as P < 0.05. Actual values are given in Table S6, SDC, http://links.lww.com/TXD/A32. “ns” not significant, *P < 0.05, **P < 0.01.
