
Figure 1.
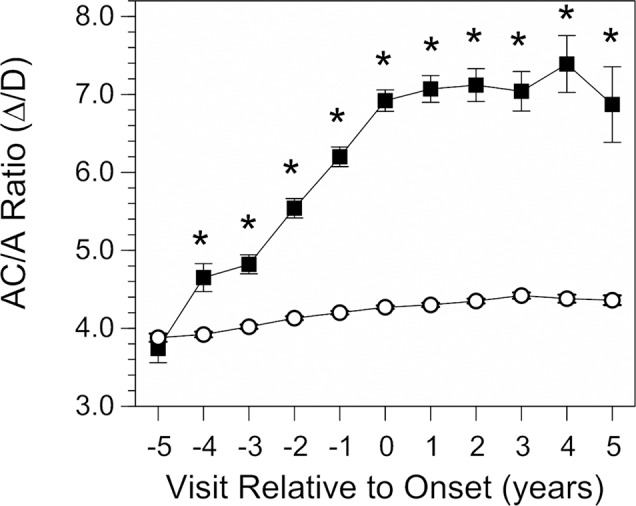
The response AC/A ratio as a function of annual visit relative to the onset of myopia (−5 years before to +5 years after onset, which is designated as visit 0). Data are from children who became myopic (▪) and from emmetrope model values (○). All error bars are ±SEM. Error bars for the emmetrope model values are smaller than the symbols. *Significant differences between groups (P < 0.01).