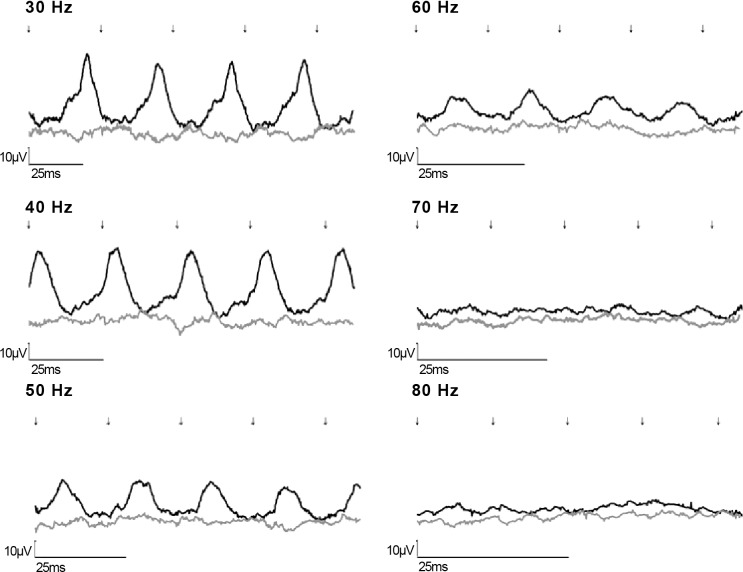
Figure 3.
Cone flicker tracings (30–80 Hz [A–F], respectively) at the highest intensity (10 cd·s/m2) following gene augmentation treatment of a day-blind sheep affected with the new missense mutation. Traces of the treated eye (black) and fellow untreated eye (dark gray line) are shown. Flash onset indicated by arrows. Note that the x-axis scale differs in each part of the figure.

