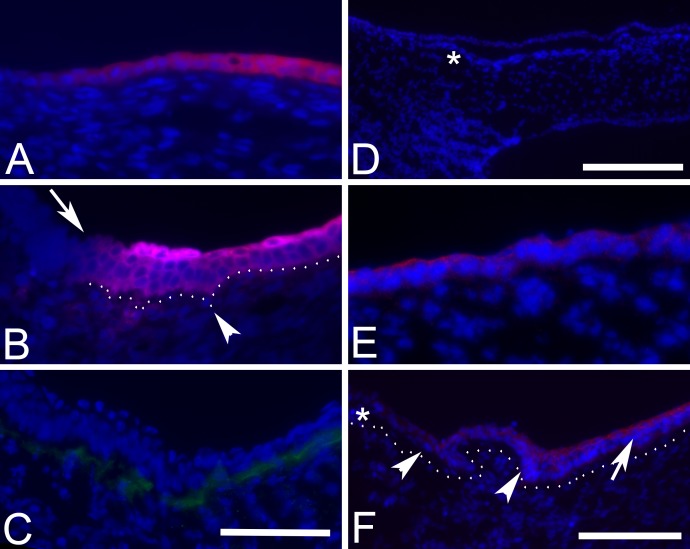
Figure 2.
Analysis of DiI diffusion in chick cornea. (A) Section of DiI (red)-labeled E9 cornea in which one small crystal placed on the CE surface shows gradual diffusion of red fluorescence within CE. (B) DiI diffusion from a large crystal of DiI in section of E13 cornea at the CE–conjunctival border shows an abrupt loss of red fluorescence (arrow) just peripheral to the end of Bowman's layer (arrowhead). Dashed line indicates Bowman's layer separating the epithelium from the stroma below. Section in C of E13 CE–conjunctival border immunolabeled for type V collagen (green) shows termination of Bowman's layer as the green label is lost. (D) Low-magnification image corneal–conjunctival border marked in the underlying stroma by *-labeled cytokeratin K3 (red) shows absence of label in the ocular surface at E8. E shows E10 cornea labeled for K3 (red) with heterogeneous staining in the apical layers of the corneal epithelium. At E17 (F), K3 (red) marks the corneal epithelium (arrow); at the corneal–conjunctival junction, label is lost in the basal cell layer (arrowheads) and completely lost more peripherally (*). Nuclei stained with DAPI (blue) in all images. Scale bar in C denotes 50 μm and is the same for A–C and E. Scale bar in D denotes 200 μm; scale bar in F denotes 100 μm.

