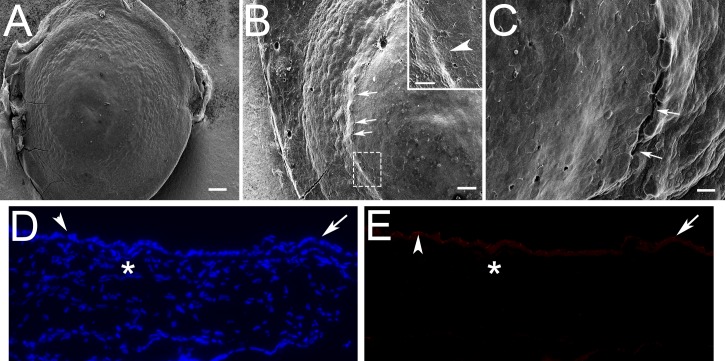
Figure 5.
Scanning electron microscopy of anterior eye surface from E6 through E8 and ZO-1 expression. Anterior eyes were imaged en face by SEM at E6 (A), E7 (B), and E8 (C). Inset in B is higher power of region enclosed by dashed box. Arrows in B show fenestrations at E7 that elongate into connections at E8 (arrows in C) at the corneal–conjunctival border. D and E are the same section labeled for nuclei with DAPI (blue in D) and ZO-1 (red in E), with an * marking the position of the corneal–conjunctival transition. Note no difference in red punctate labeling between apical cells in the conjunctival (arrowhead) versus corneal (arrow) epithelium. Scale bars in A denote 213 μm; in B denote 111 μm; in inset in B denote 48 μm; and in C denote 23 μm.

