
Figure 1.
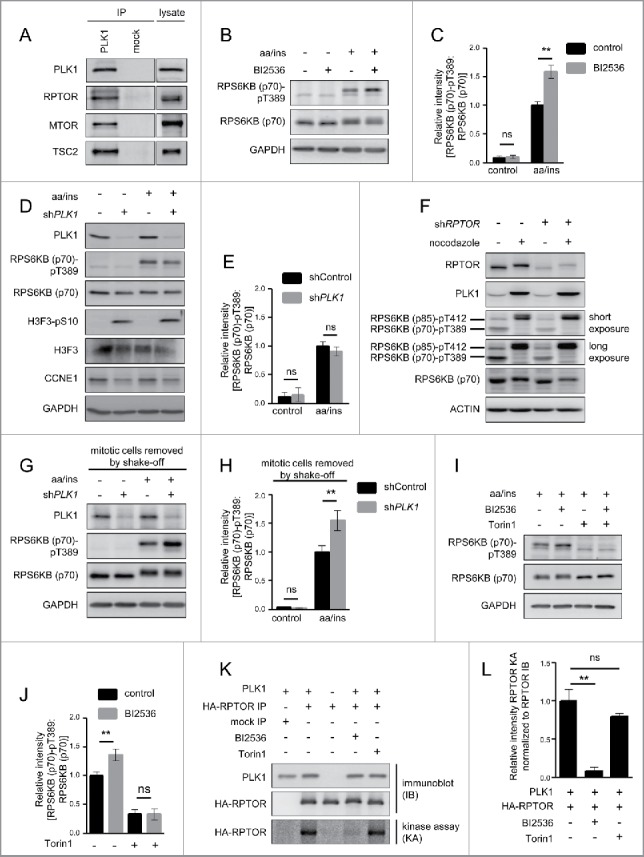
PLK1 binds and phosphorylates MTORC1, and PLK1 inhibition activates MTORC1 in interphase cells. (A) HeLa cells were cultured in full medium. Immunoprecipitation (IP) was performed with PLK1 and control (mock) antibodies. Samples were analyzed by immunoblotting. Data shown are representative of n = 4 independent experiments. (B) HeLa cells were starved for 1 h for amino acids and growth factors, stimulated with amino acids and insulin for 35 min and treated with the PLK1 inhibitor BI2536 for 30 min, as indicated. Samples were analyzed by immunoblotting. Data shown are representative of n = 3 independent experiments. (C) Quantification of data shown in (B). Ratio of RPS6KB (p70) phospho-(T389)/RPS6KB (p70) was calculated for n = 3 independent experiments. Data are normalized to 1 for the amino acid- and insulin-stimulated control condition, and represented as mean ± SEM. A one-way ANOVA followed by the Bonferroni multiple comparison test was applied; ns, nonsignificant; **, P ≤ 0.01. (D) PLK1 (shPLK1) or control (shControl) shRNA HeLa cells were starved for amino acids and growth factors for 1 h, and stimulated with amino acids and insulin for 30 min. Samples were analyzed by immunoblotting without removal of the mitotic cells. Data shown are representative of n = 3 independent experiments. (E) Quantification of data shown in (D). Ratio of RPS6KB (p70) phospho-(T389):RPS6KB (p70) was calculated for n = 3 independent experiments. Data are normalized to 1 for the amino acid- and insulin-stimulated shControl condition, and represented as mean ± SEM. A one-way ANOVA followed by the Bonferroni multiple comparison test was applied; ns, nonsignificant. (F) RPTOR shRNA (shRPTOR) or shControl HeLa cells were arrested in mitosis by nocodazole treatment. Samples were analyzed by immunoblotting. Data shown are representative of n = 3 independent experiments. (G) PLK1 (shPLK1) or control (shControl) shRNA HeLa cells were starved for amino acids and growth factors for 16 h and stimulated with amino acids and insulin for 35 min. Mitotic cells were removed by shake-off. Samples were analyzed by immunoblotting. Data are representative of n = 4 independent experiments. (H) Quantification of data shown in (G). Ratio of RPS6KB (p70) phospho-(T389):RPS6KB (p70) was calculated for n = 4 independent experiments. Data are normalized to 1 for the amino acid- and insulin-stimulated shControl condition and represented as mean ± SEM. A one-way ANOVA followed by the Bonferroni multiple comparison test was applied; ns, nonsignificant; **, P ≤ 0.01. (I) HeLa cells were treated with BI2536 and/or Torin1 as indicated, and stimulated as described in (B). Samples were analyzed by immunoblotting. Data shown are representative of n = 3 independent experiments. (J) Quantification of data shown in (I). Ratio of RPS6KB (p70) phospho-(T389):RPS6KB (p70) was calculated for n = 3 independent experiments. Data are normalized to 1 for control condition (no Torin1, no BI2536), and represented as mean ± SEM. A one-way ANOVA followed by the Bonferroni multiple comparison test was applied; ns, nonsignificant; **, P ≤ 0.01. (K) PLK1 kinase assay. HA-RPTOR was immunopurified from HeLa cells. An unspecific IgG antibody was used as negative control. All samples were dephosphorylated before adding them to the kinase reaction with recombinant PLK1. Data shown are representative of n = 3 independent experiments. IP, immunoprecipitation; IB, immunoblot; KA, kinase assay. (L) Quantification of data shown in (K) for n = 3 independent experiments. Data are normalized to 1 for HA-RPTOR phosphorylation by PLK1. Data are represented as mean ± SEM. A one-way ANOVA followed by the Bonferroni multiple comparison test was applied; ns, nonsignificant; **, P ≤ 0.01. (B, C, D, E, G, H, I) aa, amino acids; ins, insulin.