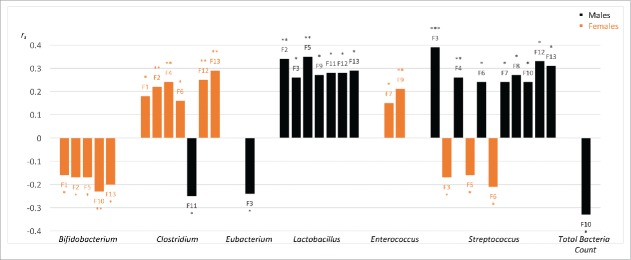
Figure 1.
Summary of significant associations between genera relative abundance (RA) and ME/CFS symptom factors (F1-F13). All significant (P ≤ 0.05) Spearman's rank order correlations (rs) are shown highlighting differences between males (black) and females (orange). RA: calculated from ratio of each genus viable count divided by t Total Bacteria Count expressed as a percentage. Total Bacteria Count: calculated from exponent value of total bacteria detectable on MALDI-TOF MS assessment. Symptom factors included: F1. Fatigue, F2. Neurocognitive, F3. Pain, F4. Sleep, F5. Neurosensory, F6. Immune, F7. Gastro-intestinal, F8. Genitourinary, F9. Sensitivities, F10. Energy Production/Transportation Impairments, F11. Mood, F12 ICC Symptom Score (sum of F1-F10), F13. Total Symptom Score (sum of F1-F11). F12 reflects diagnostic symptoms from the International Consensus Criteria (ICC) for ME/CFS. F13 also includes the mood factor (F11) as these frequently comorbid symptoms are not a diagnostic requirement. Positive correlations show that symptom factor and RA covary in the same direction i.e. either both increasing or both decreasing. An inverse monotonic association is indicated by negative correlations. Correlations can be interpreted as small (0.01), moderate (0.03) and large (0.05) effect sizes.35 *P ≤ 0.05, **P ≤ 0.01, ***P ≤ 0.001.

