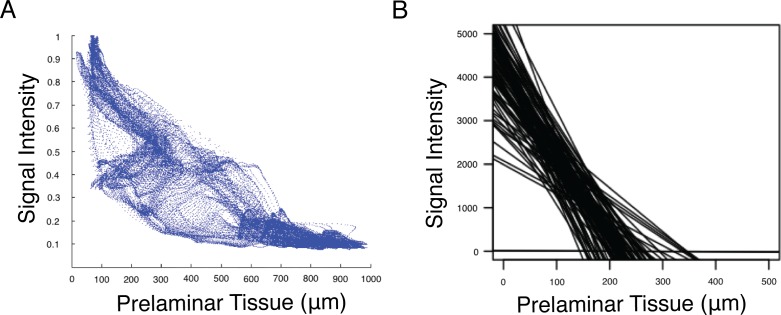
Figure 5.
(A) Example of data from one eye representing the signal intensity on an individual superpixel basis compared to the prelaminar tissue thickness measured at the corresponding location. (B) Best fit lines from all 91 eyes, demonstrating the similarity in the trends of all eyes, with weaker signal in locations with thick prelaminar and stronger signal in locations with thinner prelaminar tissue.

